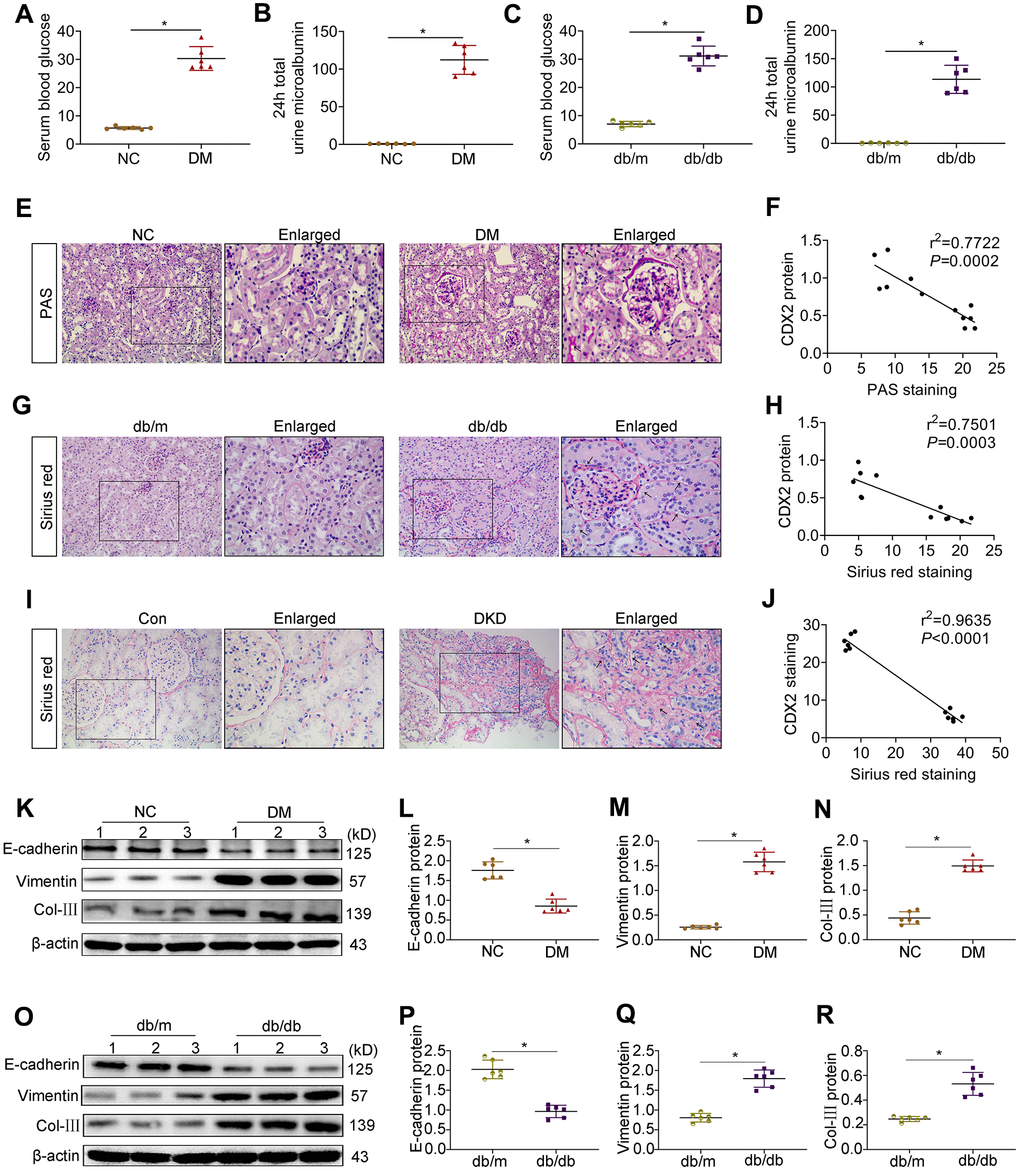
Figure 2.CDX2 is negatively related to the development of DKD. (A, B) Blood glucose (A) and 24h total urine microalbumin (B) were significantly increased in T1D mice than controls. (C, D) Blood glucose (C) and 24h total urine microalbumin (D) were significantly increased in T2D mice than controls. Positive staining density of PAS and Sirius Red was analyzed in each group from 6 random fields (200×). (E, F) PAS staining (E), correlation of CDX2 staining with PAS staining in the kidneys of T1D mice and controls (F, r = 0.7722; P = 0.0002). (G, H) Sirius Red staining (G), correlation of CDX2 staining with Sirius Red staining in kidneys of T2D mice and controls (H, r = 0.7501; P = 0.0003). (I, J) Sirius Red staining (I), correlation of CDX2 staining and Sirius Red staining in the kidneys of DKD patients and controls (J, r = 0.9635; P = 0.0001). (K–N) Immunoblot bands of E-cadherin, Vimentin, and Col-III in T1D mice and controls (K), quantitative data are presented (L–N). (O–R) Immunoblot bands of E-cadherin, Vimentin, and Col-III in T2D mice and controls (O); quantitative data are presented (P–R). Data are mean±SD from three independent assays. n=6; *P<0.05 versus NC group or db/m group or Con group.