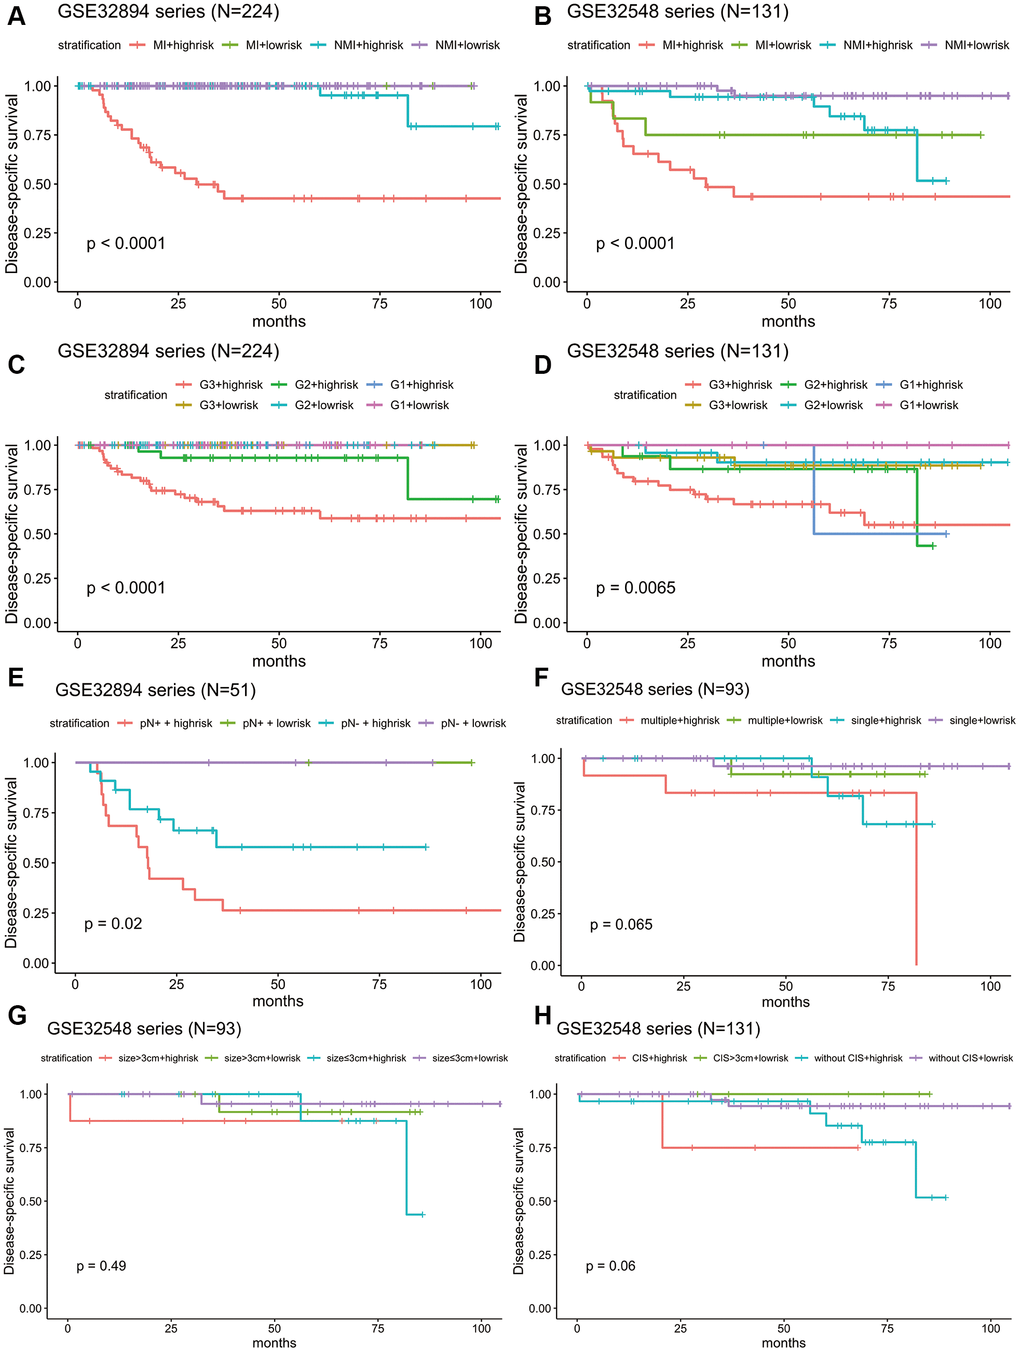
Figure 7.Kaplan-Meier estimates along with stratification of DSS for patient grouping by the signature. (A) Kaplan-Meier curves for GSE32894 (N = 224), stratified by whether muscle invasion exists (≤T2 or >T2). (B) Kaplan-Meier curves for GSE32548 (N = 131), stratified by whether muscle invasion exists (≤T2 or >T2). (C) Kaplan-Meier curves for GSE32894 (N = 224), stratified by tumour grade. (D) Kaplan-Meier curves for GSE32548 (N = 131), stratified by tumour grade. (E) Kaplan-Meier curves for patients with cystectomy in GSE32894 (N = 51), stratified by pN (pN- or pN+). (F) Kaplan-Meier curves for patients with NMIUC (G) Kaplan-Meier curves for patients with NMIUC (3 cm). (H) Kaplan-Meier curves for GSE32548 (N = 131), stratified by concomitant CIS; the tick marks on the Kaplan-Meier curves represent death from disease. The differences between the two curves were assessed by the log-rank test. MI: muscle invasion; NMI: non-muscle invasion.