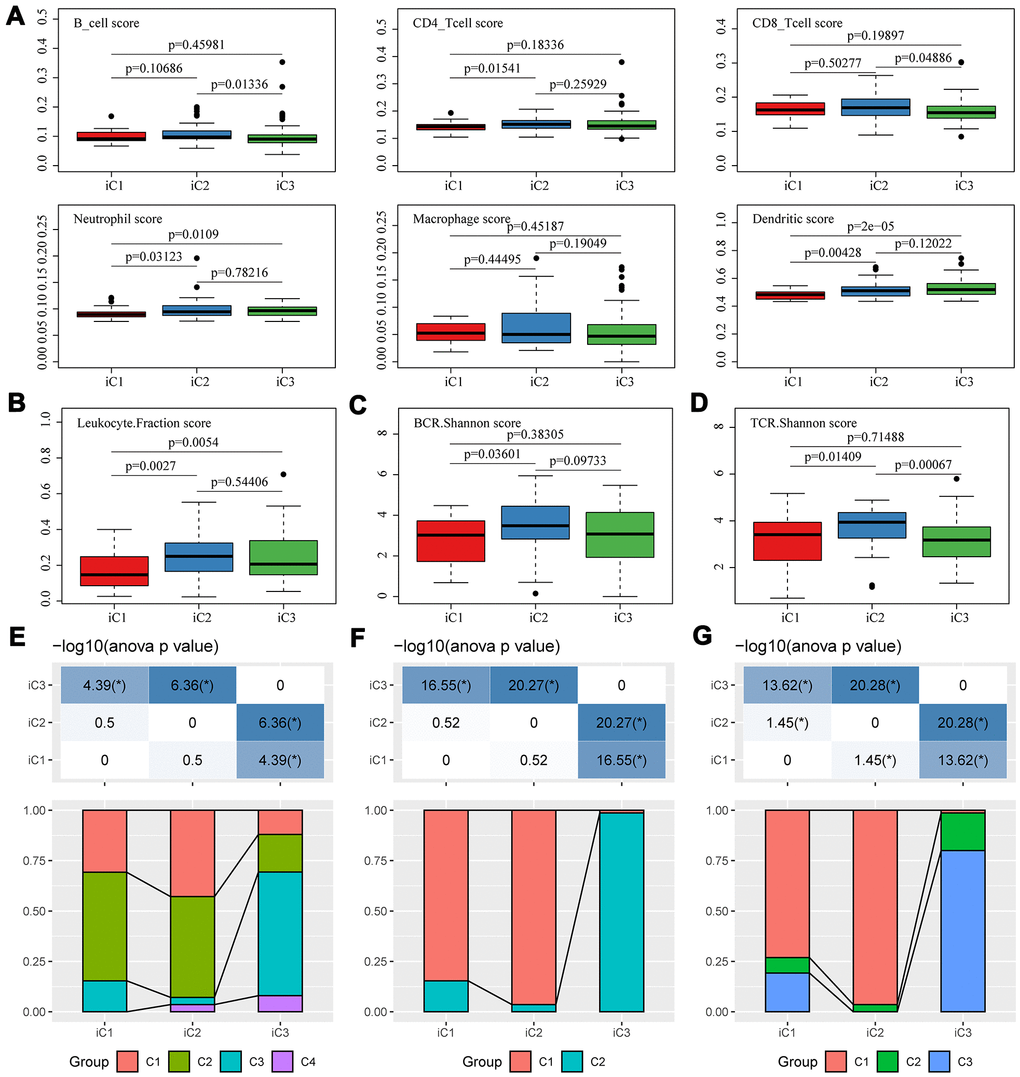
Figure 6.Microenvironmental characteristics of molecular subtypes. Distribution of (A) six immune cell scores, (B) leukocyte fractions, (C) BCR Shannon scores, (D) TCR Shannon scores across three subtypes. The mutual correlation between subtypes iC1-iC3 and TCGA-EC subtypes C1-C3 from the view of (E) CNV, (F) methylation and (G) gene expression.