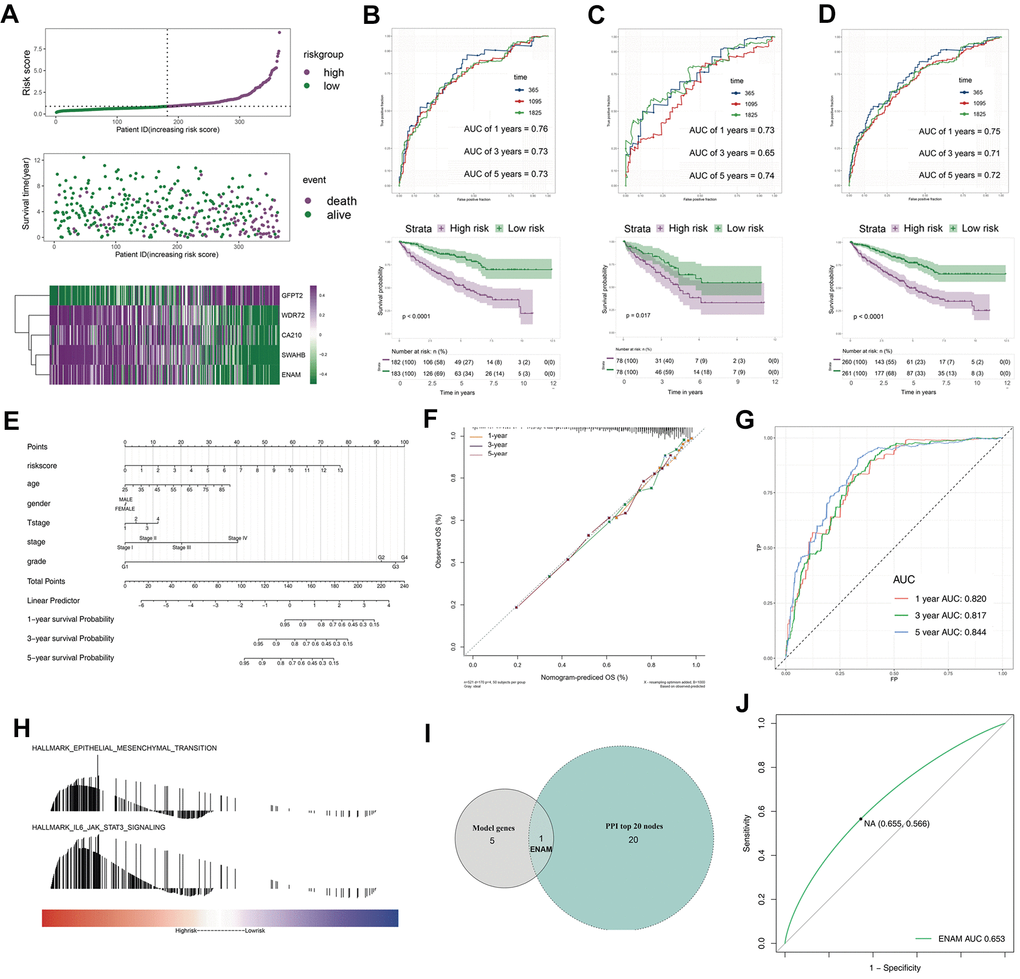
Figure 4.The evaluation of the model and the nomogram plot. (A) The risk plot of OS predictive model in TCGA-KIRC; (B) The ROC curve and Kaplan-Meier survival curves of TCGA-train group; (C) The ROC curve and Kaplan-Meier survival curves of TCGA-test group; (D) The ROC curve and Kaplan-Meier survival curves of TCGA group; (E) The nomogram plot; (F) The calibrations of 1, 3, 5 years; (G) The ROC curves of nomogram plot; (H) The GSEA analysis of high risk patients; (I) The venn plot of model genes and top 20 nodes in PPI; (J) The ROC curves of ENAM with best cutoff. Abbreviations: PPI: Protein-protein interaction.