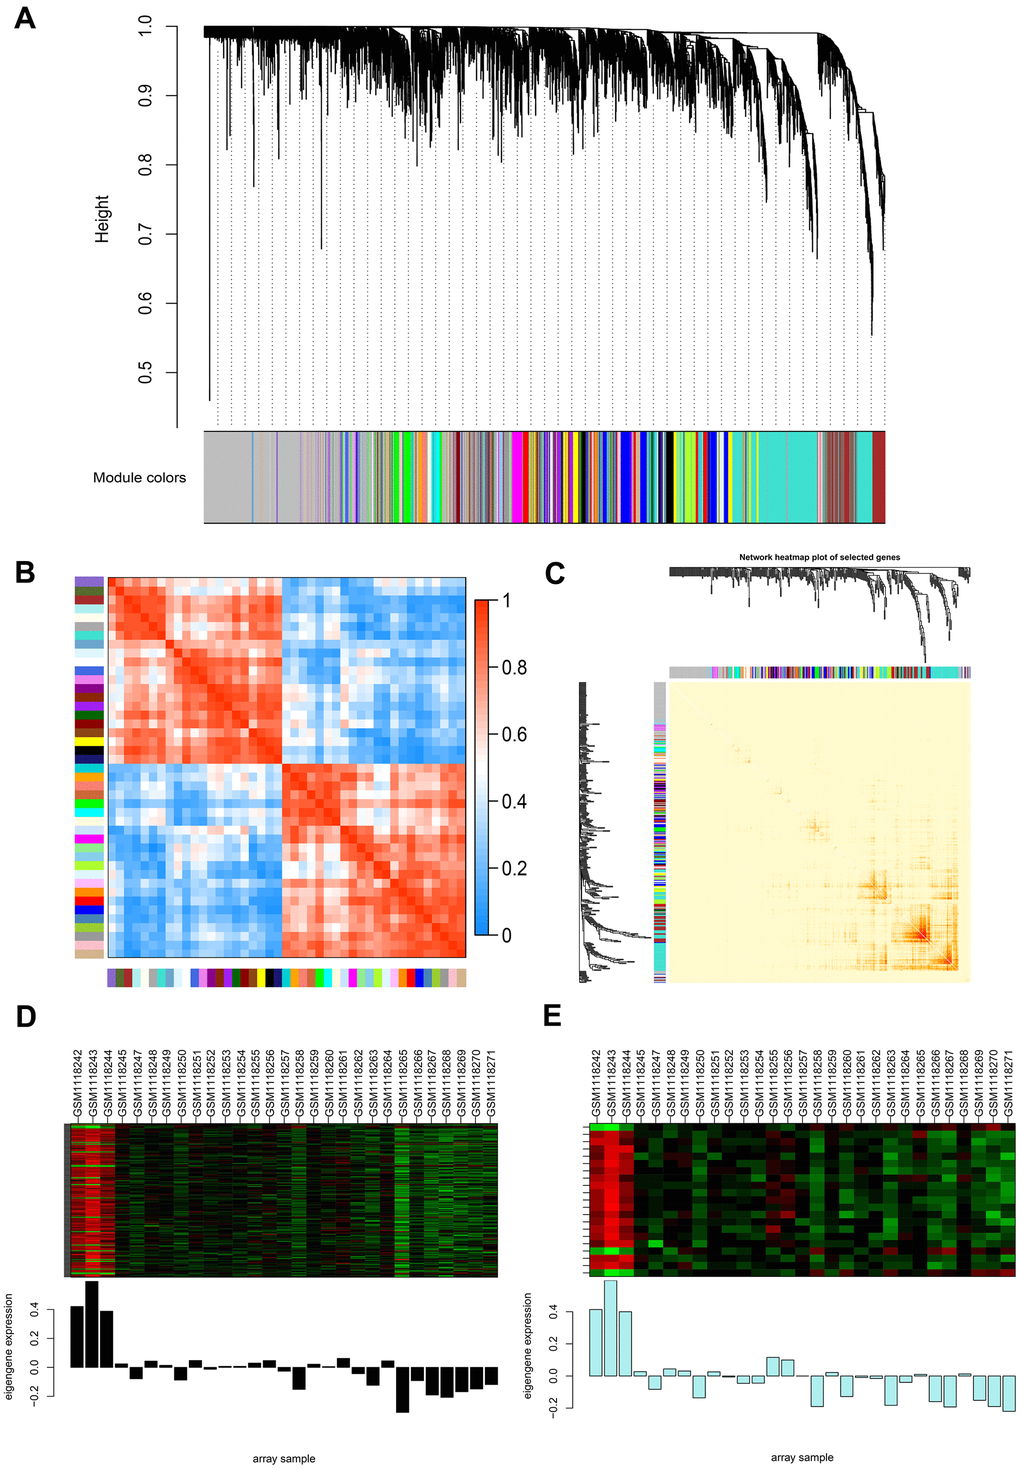
Figure 2.Weighted gene co-expression network analysis (WGCNA) of genes between the control and NOA groups. (A) Hierarchical cluster tree showing co-expression modules identified by WGCNA. The X-axis represents genes in different modules marked with different colors. (B) Heatmap plot of the adjacencies in the eigengene network. Each row and column in the heatmap correspond to one module eigengene (labeled by color). In the heatmap, the blue color represents low adjacency (negative correlation), while red represents high adjacency (positive correlation). Squares of red color along the diagonal are the meta-modules. (C) Heat map plot shows the topological overlap matrix (TOM) among 400 randomly selected genes. Light colors depict a small overlap, and the red color indicates a greater overlap. The left side and the top side show the gene dendrogram and module assignment. (D, E) Two modules with the highest relative rates were selected to localize the hub genes, they are separately colored with black (D) and pale turquoise (E). The Y-axis expressions were normalized by log2(TPM/10+1).