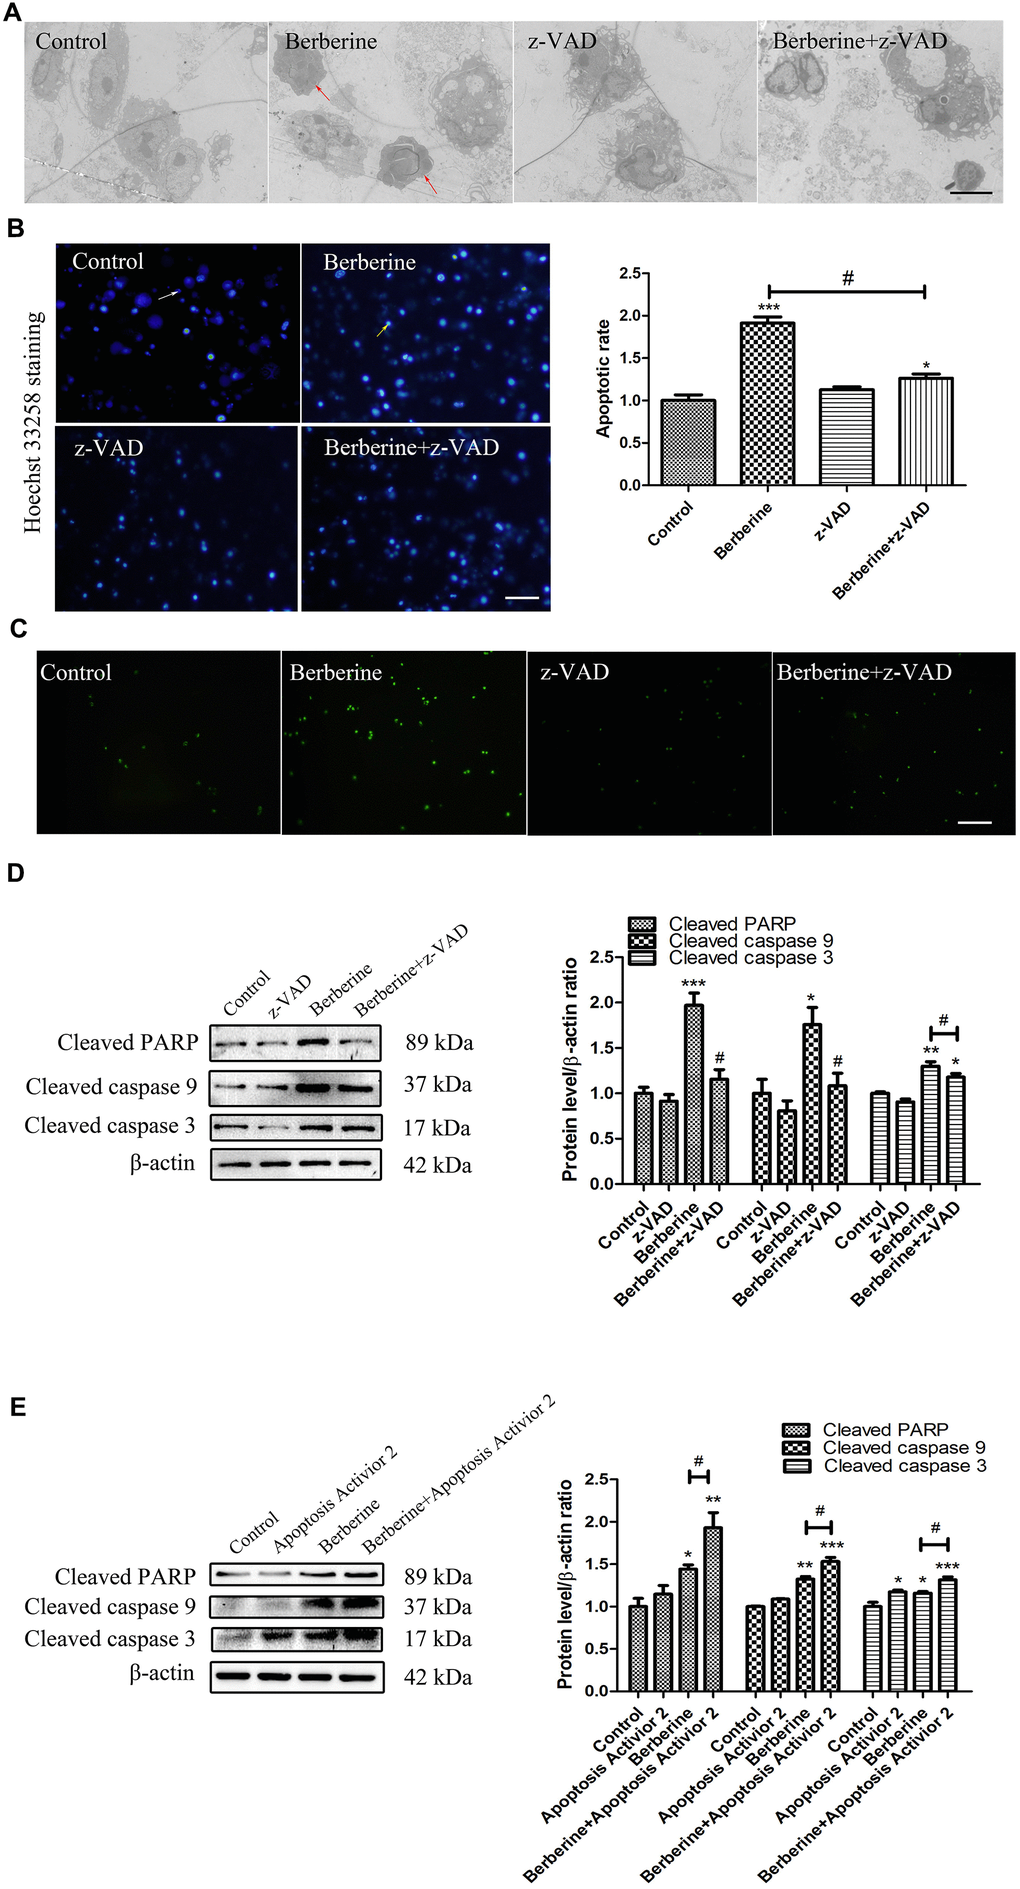
Figure 4.Berberine induces apoptosis in peritoneal macrophages. (A) Ultrastructural changes in untreated (control), z-VAD only, and berberine (100 μmol/L)-treated with or without z-VAD peritoneal macrophages observed by TEM at 10 h. Scale bar, 2 μm. Red arrows indicate that the cells showed typical apoptotic morphological changes, including the disappearance of cell microvilli, nuclear chromatin condensation on the nuclear envelope, and significant mitochondrial swelling with disappearing crista. (B) Apoptosis of peritoneal macrophages detected by Hoechst 33258 assay. Normal cells are indicated by uniform blue fluorescence (white arrow). Apoptotic cells appear as bright blue, fluorescent spots (yellow arrow, 0.1 mm). The percentage of apoptotic peritoneal macrophages ratio is shown. Scale bar, 500 μm (100 μmol/L berberine, 10 h incubation). Data was analyzed by one-way ANOVA with Tukey HSD post-hoc test (vs. Control group). Analysis of variance and Student-Newman-Keuls post hoc tests were used to compare two group (vs. berberine group). (C) Peritoneal macrophages in control, z-VAD only, and berberine-treated with or without z-VAD groups incubated with TUNEL reagent for 30 min. Scale bar, 500 μm (100 μmol/L berberine, 10 h incubation). (D) The effect of z-VAD on the protein content of cleaved PARP, cleaved caspase 9, and cleaved caspase 3 at 10 h after treatment with 100 μmol/L berberine. Quantification of proteins is shown. Data was analyzed by one-way ANOVA with Tukey HSD post-hoc test (vs. Control group). Analysis of variance and Student-Newman-Keuls post hoc tests were used to compare two group (vs. berberine group). (E) The effect of apoptosis activator 2 on the expression of cleaved PARP, cleaved caspase 9, and cleaved caspase 3 at 10 h after treatment with 100 μmol/L berberine. Quantification of proteins is shown. Data was analyzed by one-way ANOVA with Tukey HSD post-hoc test (vs. Control group). Analysis of variance and Student-Newman-Keuls post hoc tests were used to compare two group (vs. berberine group). All values are expressed as mean ± SD (error bars) of three independent experiments. n = 3; *p < 0.05, **p < 0.01, and ***p < 0.001 versus control. #p < 0.05 versus berberine group.