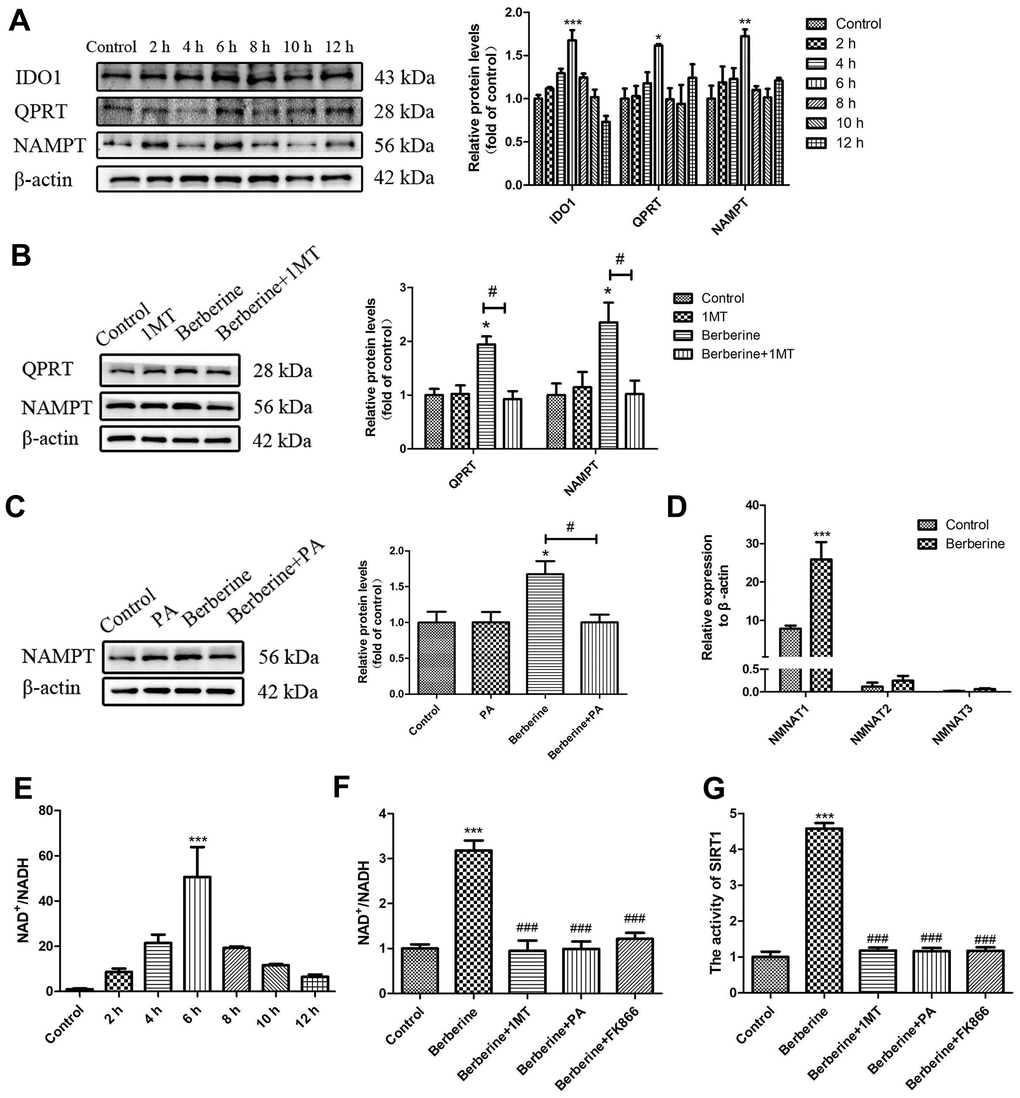
Figure 7.Berberine activates SIRT1 via the NAD+ synthesis pathway. (A) The relative protein expression of NAD+ synthesis pathway enzymes after treatment with 100 μmol/L berberine at different time points. Data was analyzed by one-way ANOVA with Tukey HSD post-hoc test (vs. Control group). (B) The effect of 1MT on the relative protein expression of NAD+ synthesis pathway enzymes after treatment with 100 μmol/L berberine. Data was analyzed by one-way ANOVA with Tukey HSD post-hoc test (vs. Control group). Analysis of variance and Student-Newman-Keuls post hoc tests were used to compare two group (vs. berberine group). (C) The effect of PA on the relative protein expression of NAMPT after treatment with 100 μmol/L berberine. Data was analyzed by one-way ANOVA with Tukey HSD post-hoc test (vs. Control group). Analysis of variance and Student-Newman-Keuls post hoc tests were used to compare two group (vs. berberine group). (D) The mRNA levels of NMNAT 1 to 3 after treatment with 100 μmol/L berberine. Data was analyzed by one-way ANOVA with Tukey HSD post-hoc test (vs. Control group). (E) NAD+/NADH level in peritoneal macrophages at different incubation time points after treatment with 100 μmol/L berberine. Data was analyzed by one-way ANOVA with Tukey HSD post-hoc test (vs. Control group). (F) The NAD+/NADH level in peritoneal macrophages following different treatments (100 μmol/L berberine, 6 h incubation). Data was analyzed by one-way ANOVA with Tukey HSD post-hoc test (vs. Control group). Analysis of variance and Student-Newman-Keuls post hoc tests were used to compare two group (vs. berberine group). (G) The activity of SIRT1 after different treatments (100 μmol/L berberine, 6 h incubation). Data was analyzed by one-way ANOVA with Tukey HSD post-hoc test (vs. Control group). Analysis of variance and Student-Newman-Keuls post hoc tests were used to compare two group (vs. berberine group). All values are expressed as mean ± SD (error bars) of three independent experiments. n = 3; *p < 0.05, **p < 0.01, and ***p < 0.001 versus control. #p < 0.05, ###p < 0.001 versus berberine group.