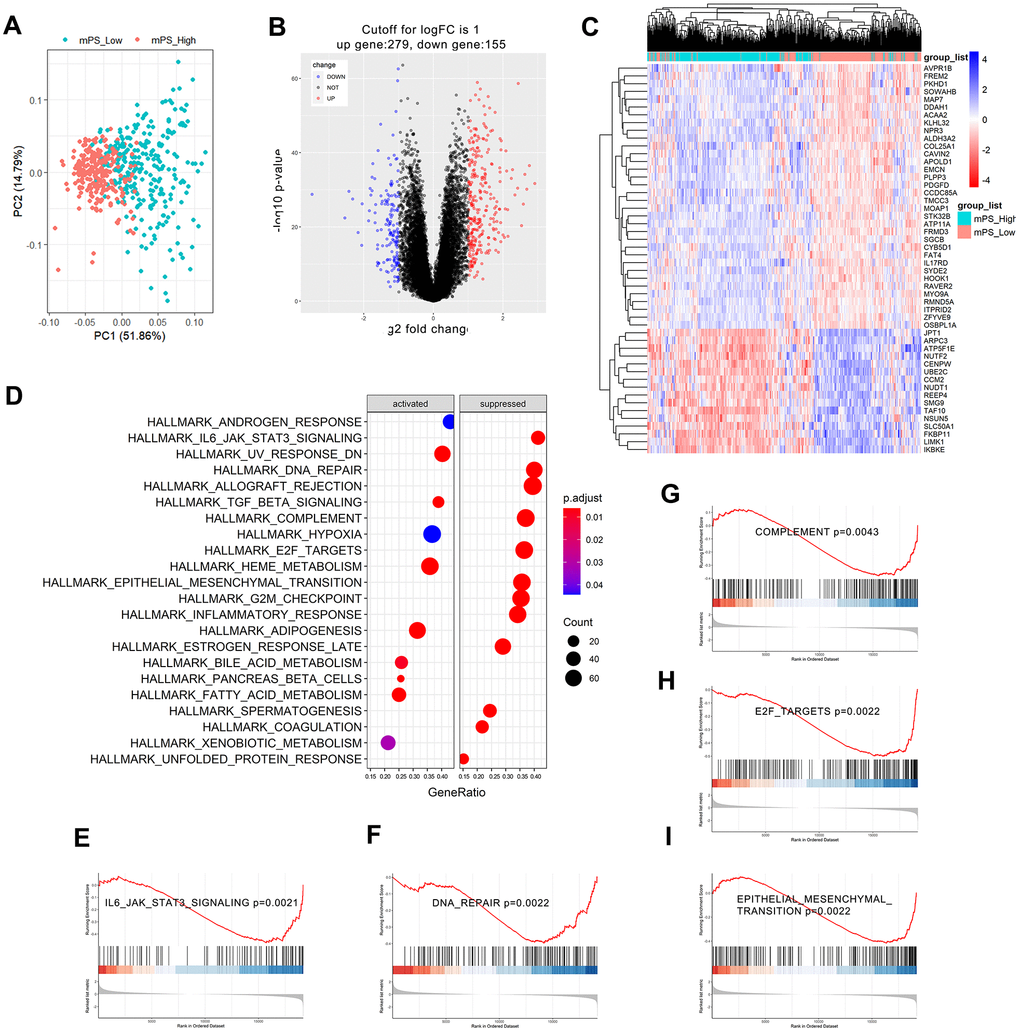
Figure 6.GSEA analysis results of differentially expressed genes between low- and high-mPS groups. (A) Principal component analysis result; (B) Volcano plot of the differentially expressed genes; (C) The heat map of the top 50 differentially expressed genes; (D) Significantly enriched activated and suppressed KEGG pathways. The vertical items are the names of KEGG terms, and the length of horizontal graph represents the gene ratio. The depth of the color represents the adjusted p-value. The area of circle in the graph means gene counts. (E–I) GSEA-based KEGG-enrichment plots of representative gene sets from activated and suppressed pathways: “IL6/JAK/STAT3 signaling” (E), “DNA repair” (F), “complement” (G), “E2F targets” (H), and “epithelial mesenchymal transition” (I).