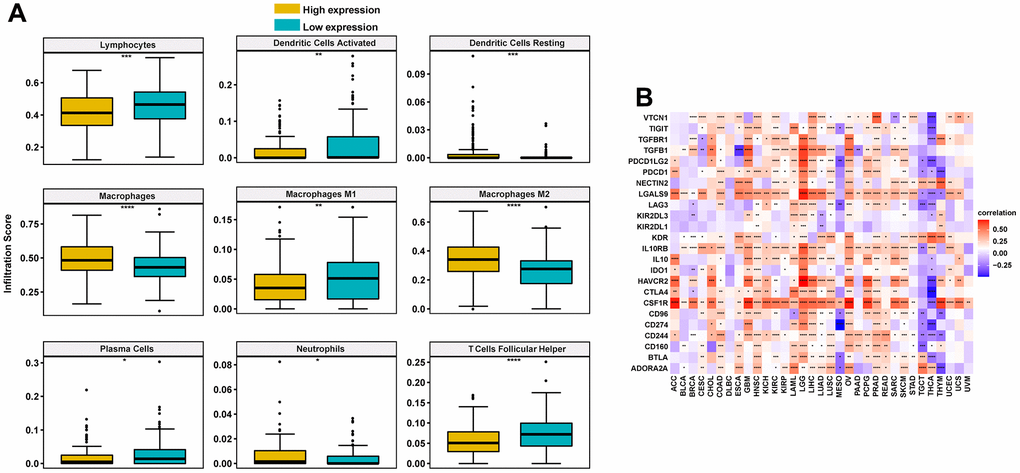
Figure 5.Correlation between immune cell infiltration and FCGBP in ovarian cancer. (A) Immune cell infiltration level in the high FCGBP expression group and low FCGBP expression group in TCGA cohort. (B) Correlations between FCGBP and immunosuppressive genes are shown in a heatmap, where red represents positive correlation, blue represents negative correlation; the deeper the color, the stronger the correlation.