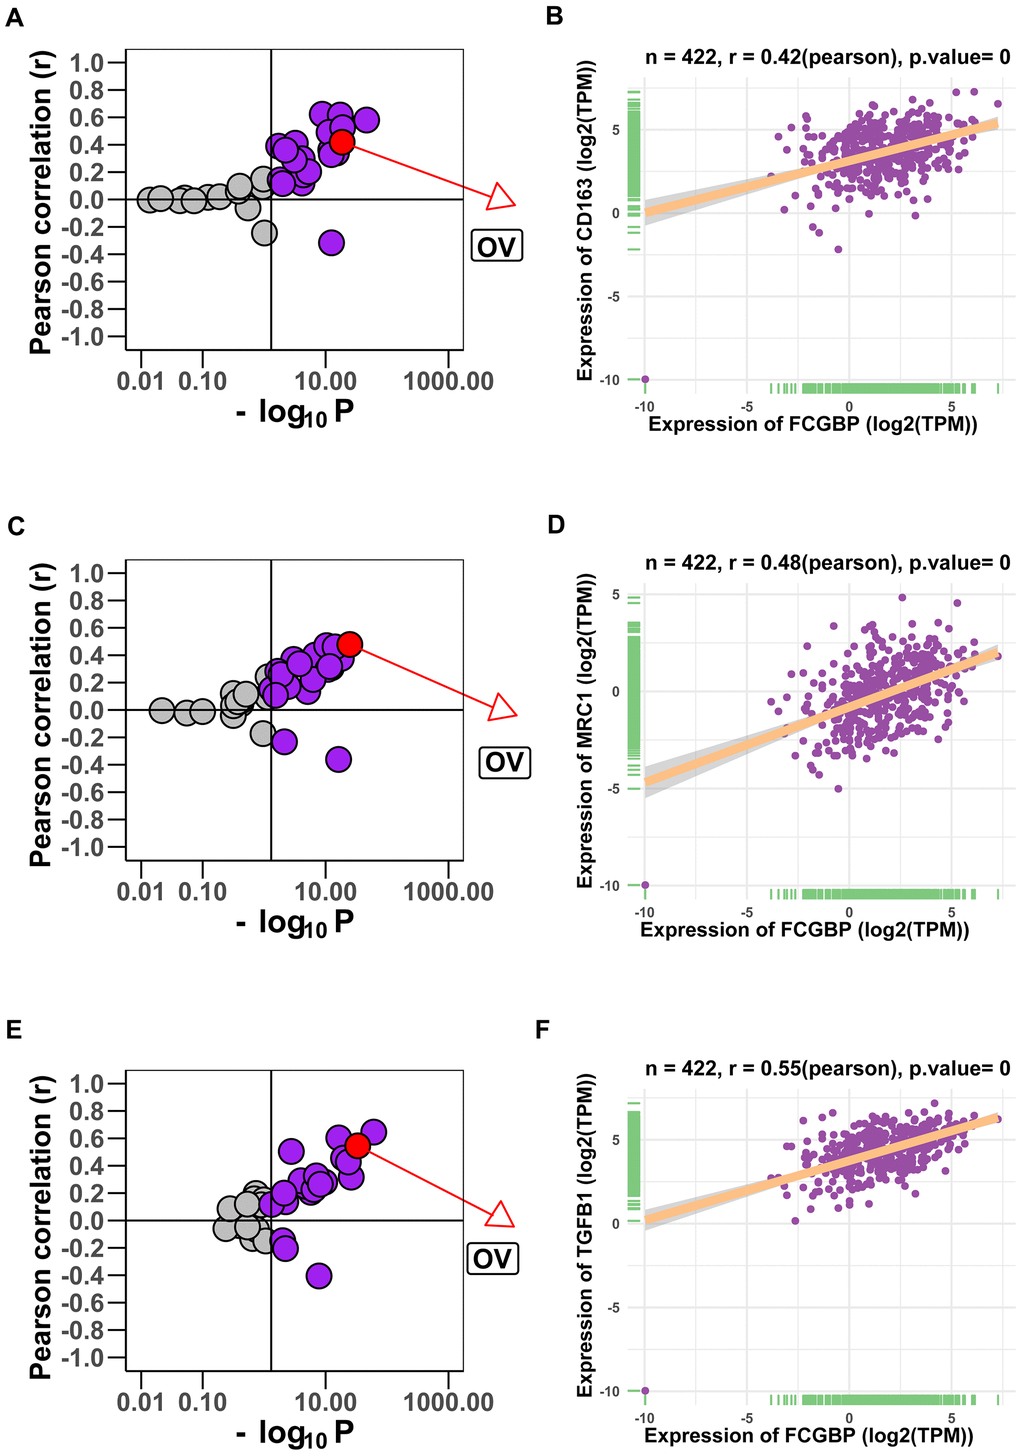
Figure 7.Correlation between FCGBP expression and gene markers of M2-like macrophages. (A, B) Correlation between FCGBP expression and CD163 in pan-cancer (A) and ovarian cancer (B). Each circle represents a type of cancer; purple circles represent meaningful correlations (Pearson p < 0.05). (C, D) Correlation between FCGBP expression and MRC1 in pan-cancer (C) and ovarian cancer (D). (E, F) Correlation between FCGBP expression and TGFB1 in pan-cancer (E) and ovarian cancer (F).