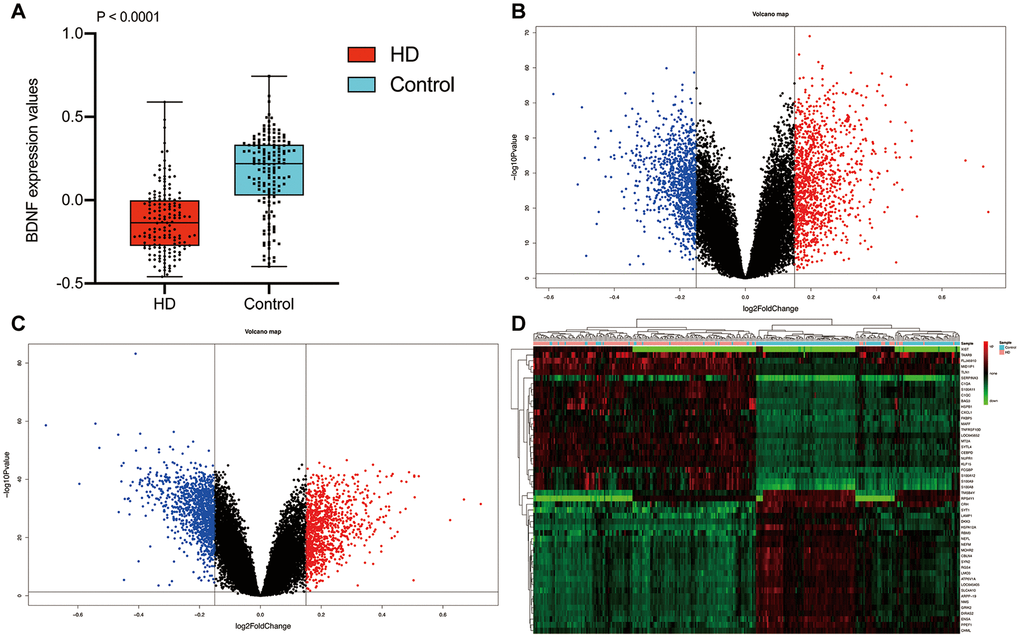
Figure 2.Differential expression gene analysis. BDNF expression between HD and non-dementia controls (A). Distribution of DEGs in the HD / control (B) and BDNF-low / high group (C): blue represents down-regulated and red indicates up-regulated. Heatmap of the top 25 down-regulated and up-regulated genes (D). HD: Huntington’s disease, DEGs: differential expression genes.