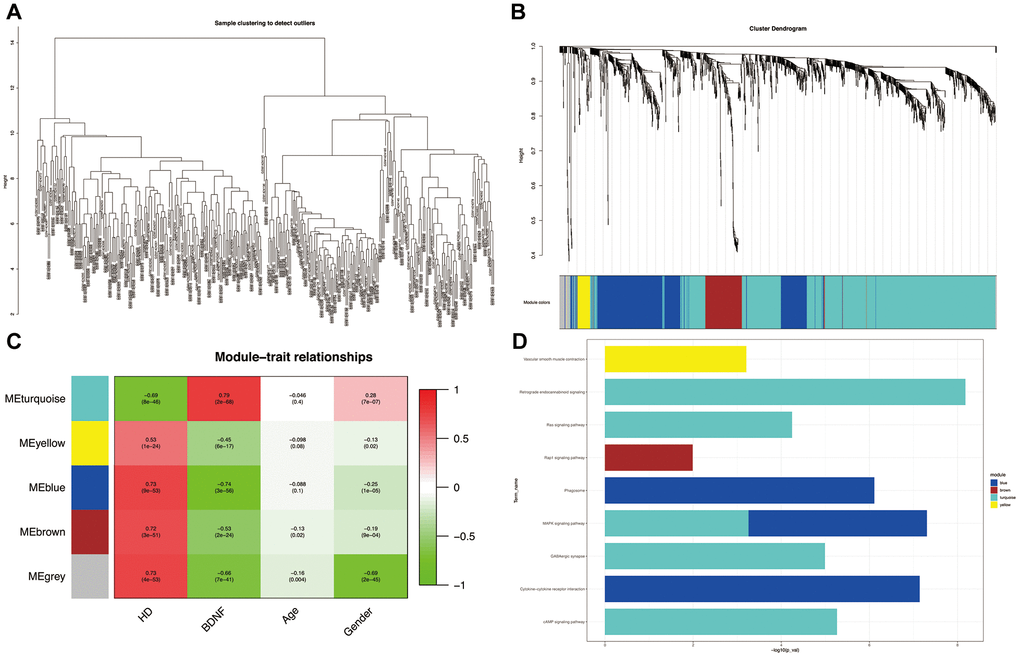
Figure 3.Weighted correlation network analysis. Plot of sample clustering (A). Cluster dendrogram of five modules and assigned module colors (B): grey indicates non-clustering genes. Heatmap of module-trait relationships (C): red indicates positively correlated and green represents negatively correlated. KEGG pathways of genes in co-expression module (D). HD: Huntington’s disease, KEGG: Kyoto Encyclopedia of Genes and Genomes.