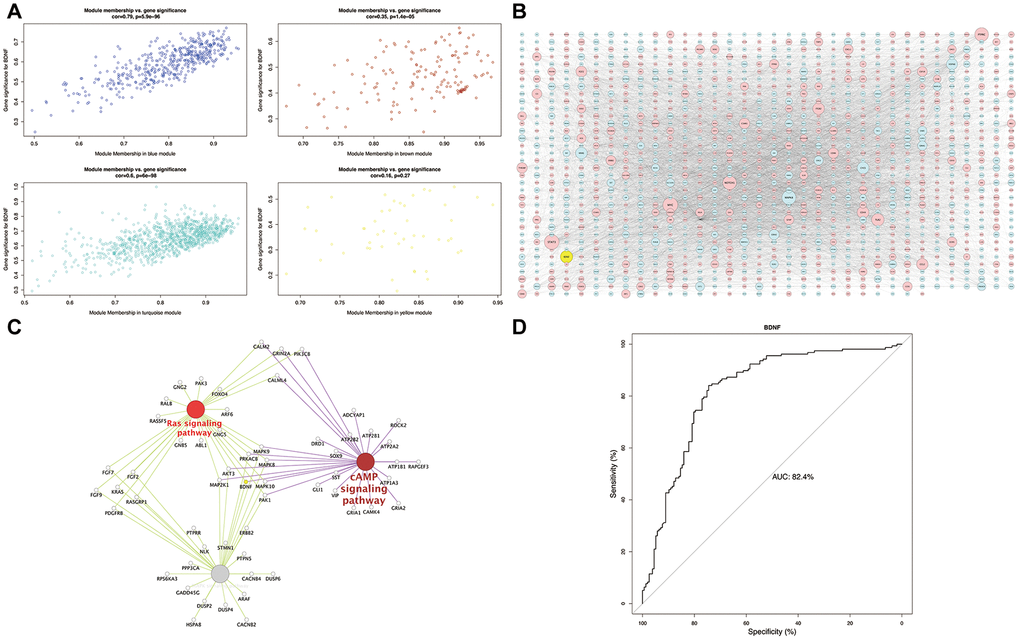
Figure 4.Module-pathway regulatory network and AUC analysis. Scatterplot of module membership vs. gene significance (A). Global regulatory network of blue and turquoise modules (B): red represents high expression; blue and yellow indicate low expression; node size indicates the degree of gene connectivity. Enrichment analyses of BDNF intersection pathways (C): yellow indicates the low BDNF expression. Performance evaluation of low BDNF in HD prediction (D). AUC: area under the curve, HD: Huntington’s disease.