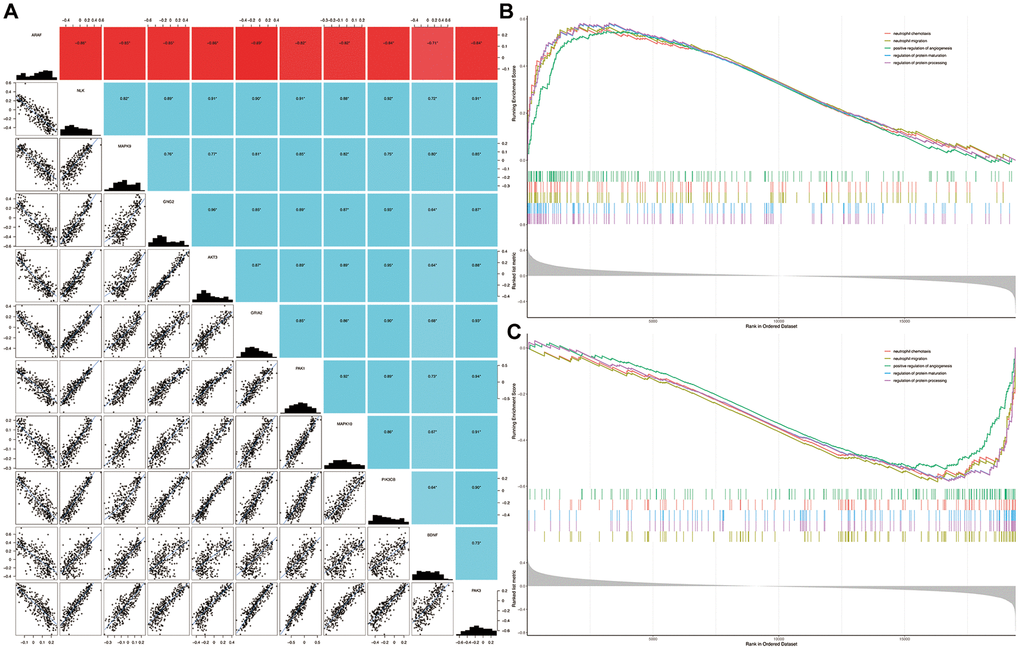
Figure 5.Correlation among genes and gene set enrichment analysis. Correlation of BDNF with signature genes (A): *P < 0.05; red indicates negative correlation; blue represents positive correlation. Biological processes enriched in HD (B) and BDNF-low (C) groups. HD: Huntington’s disease.