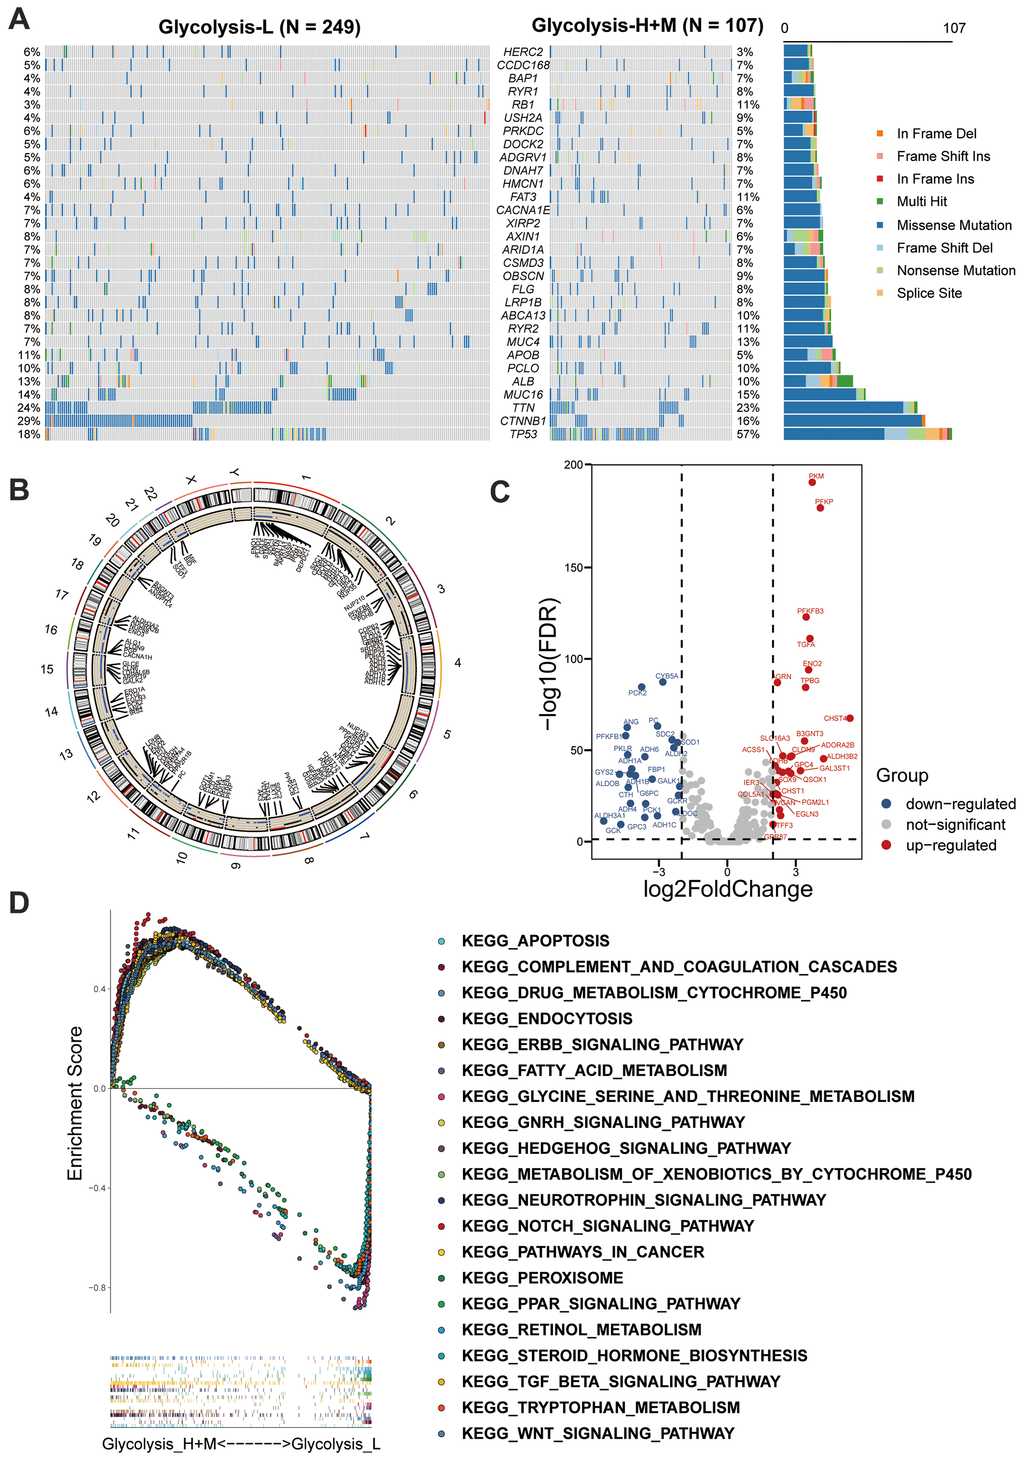
Figure 3.Multi-omics analysis among glycolysis-associated HCC subgroups. (A) The waterfall plot showed the mutation type of each patient and the proportion of mutation in each subgroup. 30 genes with the most frequent somatic mutation in HCC patients from TCGA were listed. (B) Differences in CNV profiles of the different glycolysis-associated HCC subtypes were visualized, gains of CNVs shown in black, and losses in blue. (C) Volcano plot showed the between Glycolysis-H+M subgroups and Glycolysis-L subgroup (FDR < 0.05 and |log2fold-change (FC)| > 1). (D) GSEA analysis of Glycolysis-H+M subgroups and Glycolysis-L subgroup. CNV, copy number variation; DEGs, differentially expressed genes; GSEA, Gene-set enrichment and functional enrichment analyses.