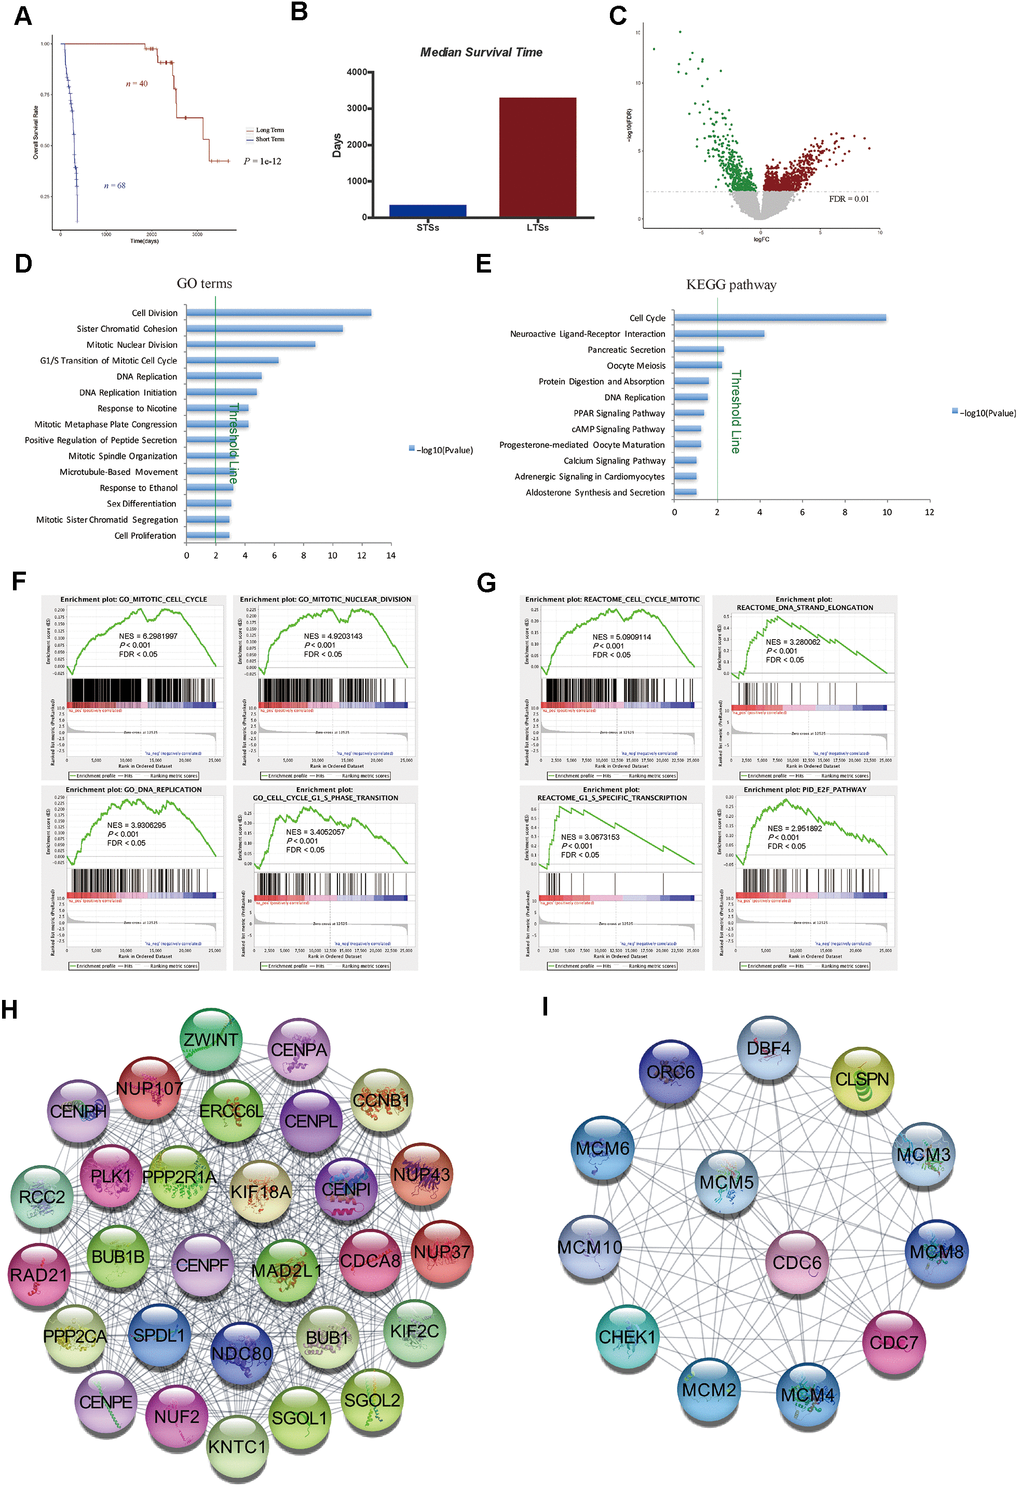
Figure 1.Gene expression profiling of LTSs and STSs of HCC. (A) Kaplan-Meier curve and log-rank test of STSs and LTSs of HCC. (B) The median survival days of STSs and LTSs of HCC. (C) Volcano plot of DEGs between 68 STS HCC samples and 40 LTS HCC samples. Red dots represent upregulated genes and green dots represent downregulated genes in HCC samples from STSs. (D) and (E) GO analysis (D) and KEGG pathway analysis (E) of DEGs via DAVID. Blue bars that cross the threshold line (P < 0.01) represent GO terms or KEGG pathways that differed significantly between the 68 STS HCC samples and the 40 LTS HCC samples. (F) and (G) GSEA of the global gene expression profiles of 68 STS HCC samples and 40 LTS HCC samples. Gene sets annotated with GO terms (F) and Gene sets annotated with canonical pathways mainly from Reactome and PID databases (G) were used in the analysis. NES = normalized enrichment score; P = nominal P value; FDR = false discovery rate. (H) and (I) The MCODE algorithm was used to identify the most significant modules in the PPI network constructed from the upregulated genes in STS HCC samples. The MCODE score of module 1 was 29 (H). The MCODE score of module 2 was 13 (I).