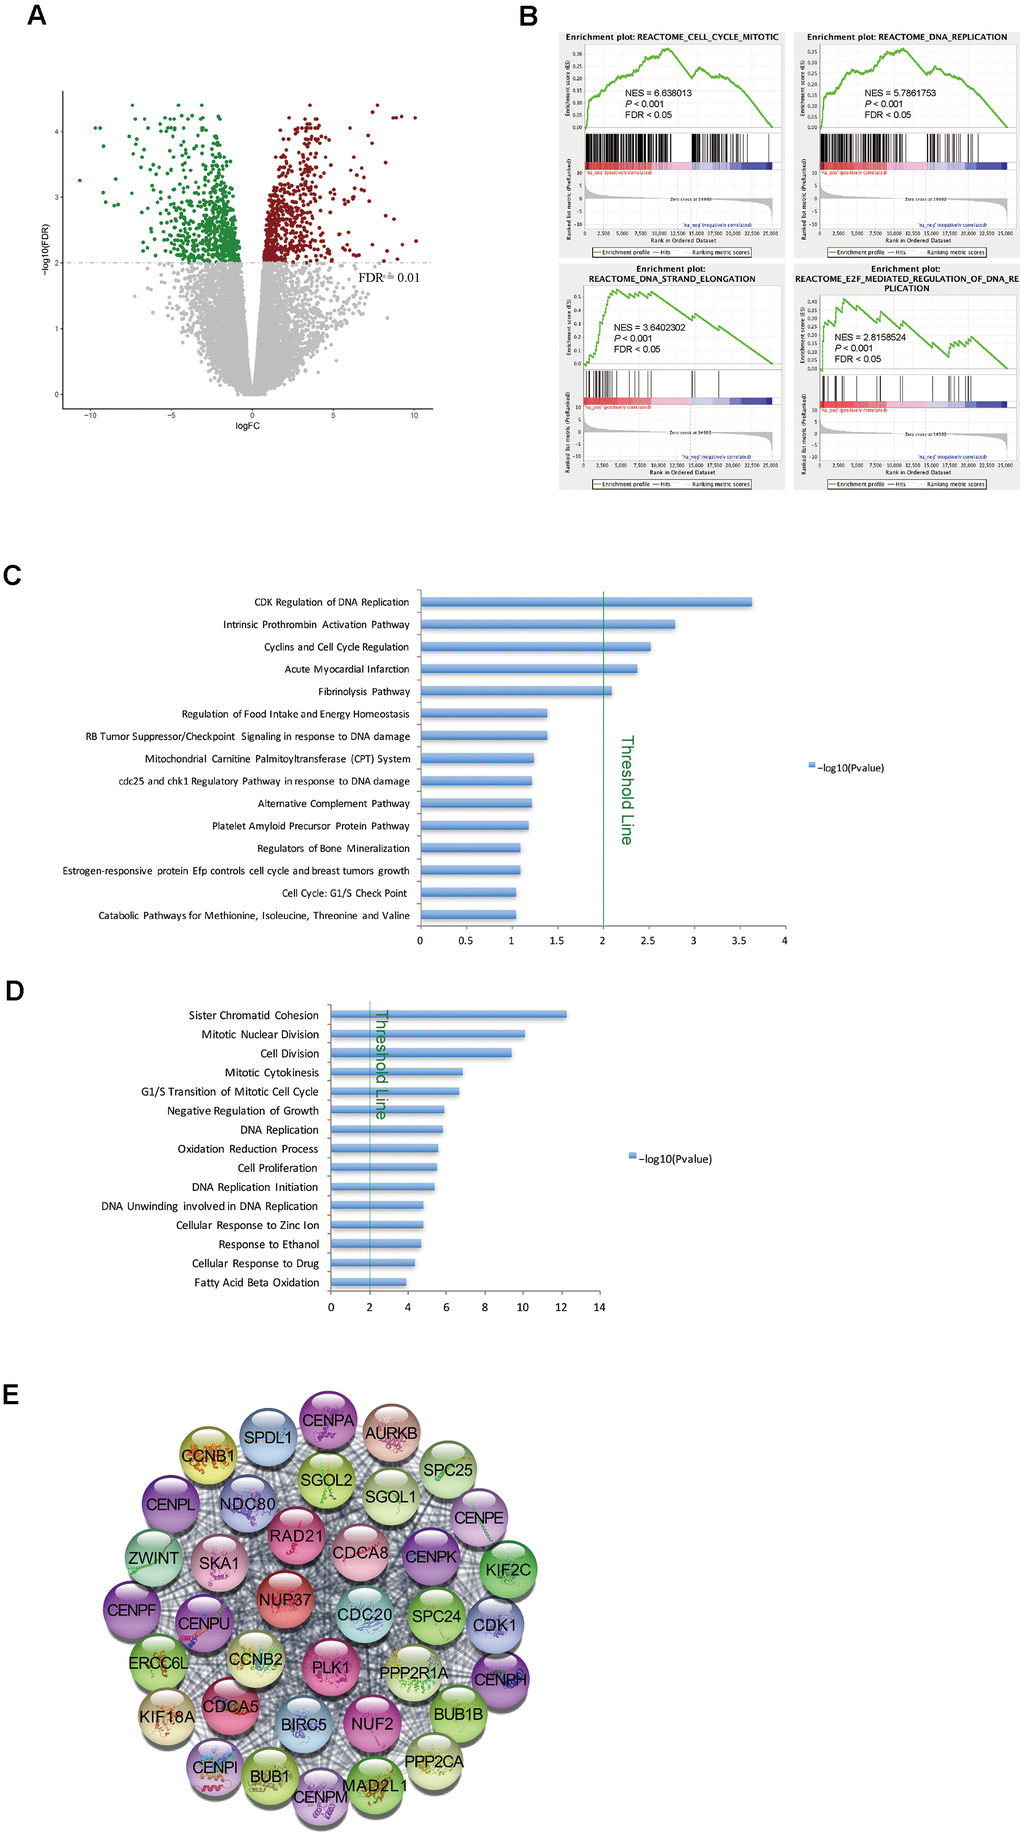
Figure 2.Cell cycle pathways were enriched in tumor samples from STSs. (A) Volcano plot of the DEGs between primary tumor tissues and matched normal liver tissues from nine STSs. Red dots represent upregulated genes and green dots represent downregulated genes in the primary tumor tissues. (B) GSEA of the global gene expression profiles of nine primary tumor tissues and matched normal liver tissues from STSs. Gene sets were annotated with canonical pathways mainly from Reactome. NES = normalized enrichment score; P = nominal P value; FDR = false discovery rate. (C) and (D) BioCarta pathway analysis (C) and GO analysis (D) of DEGs via DAVID. Blue bars that cross the threshold line (P < 0.01) represent pathways that differed significantly between primary tumor tissues and matched normal liver tissues from nine STSs. (E) The MCODE algorithm was used to identify the most significant module in the PPI network constructed from the upregulated genes in STS HCC samples. The MCODE score of this module was 37.