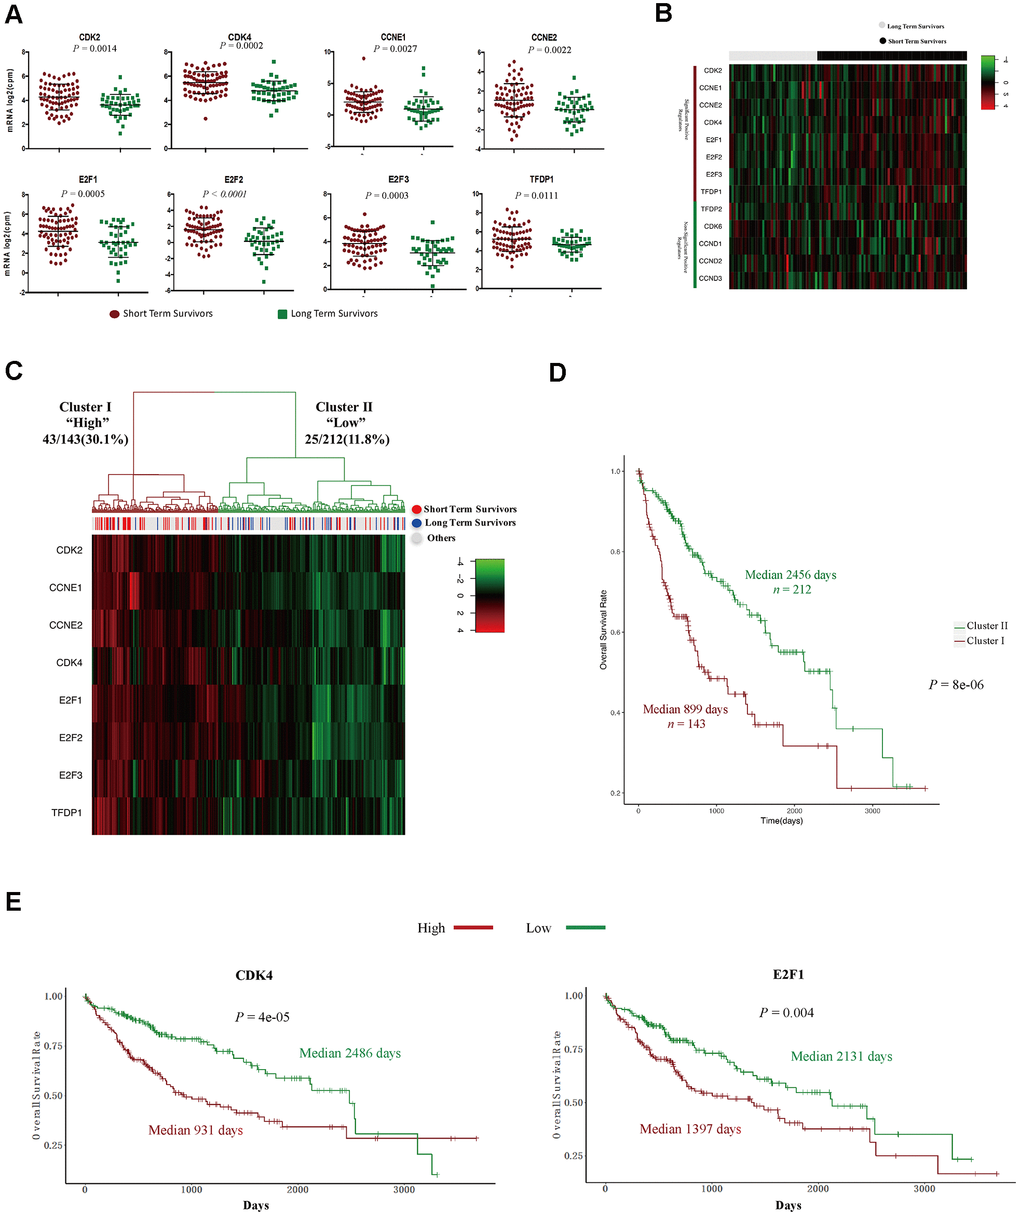
Figure 4.The expression signature of eight positive regulators of the G1/S cell cycle transition was an independent prognostic factor in HCC. (A) Tumor sample transcriptomic profiling of eight positive regulators of the G1/S cell cycle transition that differed significantly between STSs and LTSs of HCC. The data are shown as the mean ± standard deviation, and were compared using an unpaired two-tailed Student’s t-test. cpm, counts per million. (B) Tumor sample expression signature heatmap of thirteen positive regulators of the G1/S cell cycle transition in STSs and LTSs of HCC. Rows indicate the genes and columns indicate the patients. The patient survival status for each tumor is depicted directly above each column. (C) Unsupervised hierarchical clustering with Euclidean distances and Ward linkages of the expression matrix of eight positive regulators of the G1/S cell cycle transition in 355 HCC samples. Rows indicate the genes and columns indicate the patients. The patient survival status for each tumor is depicted directly above each column. (D) Kaplan-Meier curves for the clusters resulting from the unsupervised hierarchical clustering in (C). (E) Kaplan-Meier curve and log-rank test for HCC patients based on the expression of CDK2 and E2F1.