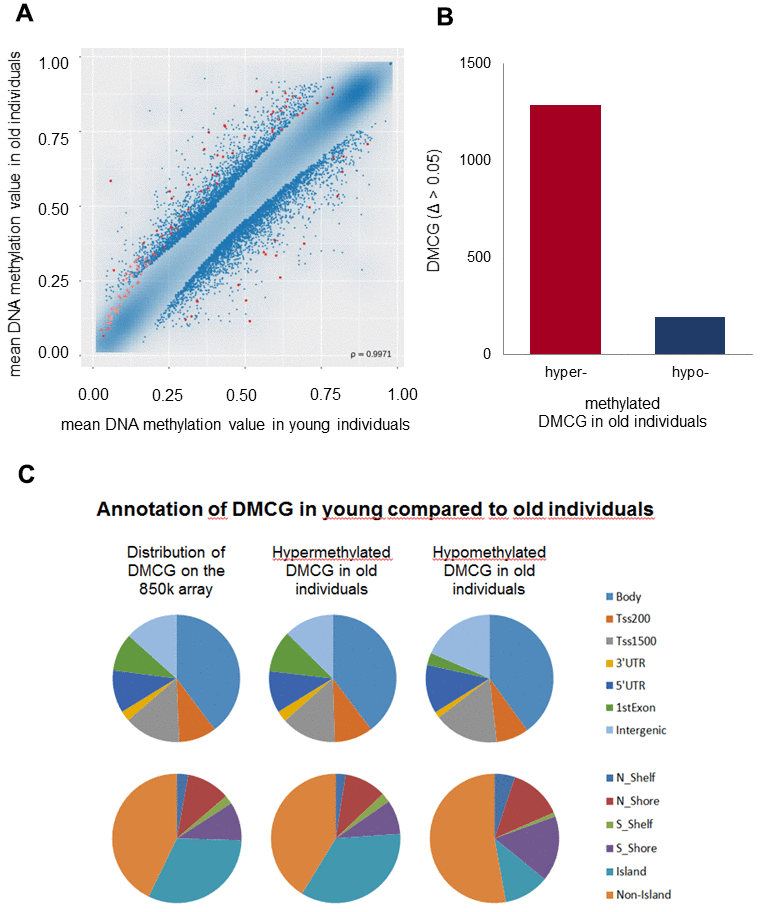
Figure 1.Genome-wide DNAm analysis. Genome-scale DNAm profiles derived from the RnBeads software package. (A) Scatter plot based on the mean DNAm values of each analysed CpG site of the individual trial participants compared between the young and old cohort (red dots correspond to dmCGs with p-values < 0.05). The correlation coefficient is ρ = 0.9971. (B) Numbers of differentially hypo- and hypermethylated CpGs (DMCG) in old compared to young individuals demonstrate distinctly more hyper- than hypomethylated DMCG in old compared to young individuals. (C) Hypo- and hypermethylated dmCGs are annotated in terms of gene regulatory regions (intergenic gene regions, 1st exon, 3′; and 5′; untranslated region (UTR), gene body, promoter areas: transcription start sites (TSS) 1500 and 200; upper pie charts), and CGIs (CGIs and flanking regions before (N shelf, N shore) and after (S shelf, S shore) CGIs; lower pie charts) in comparison to the overall distribution of markers on the whole 850 K array (left pie charts), respectively.