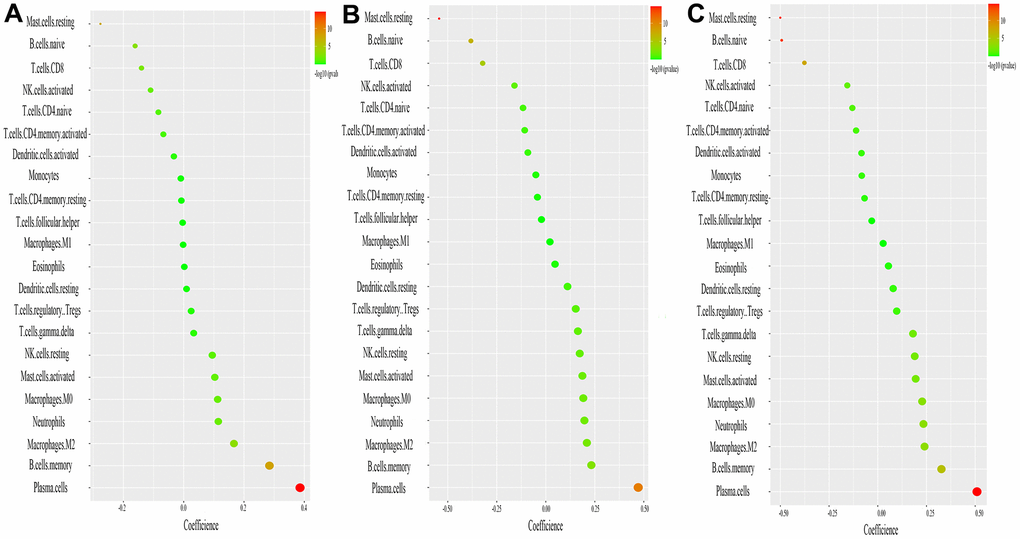
Figure 7.Correlation between ASCC2, LRRC8, SLC25A37, and infiltrating immune cells. (A) Correlation between ASC2 and infiltrating immune cells. (B) Correlation between LRRC18 and infiltrating immune cells. (C) Correlation between SLC25A37 and infiltrating immune cells. The size of the dots represents the strength of the correlation between genes and immune cells; the larger the dots, the stronger the correlation. The color of the dots represents the p-value, the greener the color, the lower the p-value. p < 0.05 was considered statistically significant.