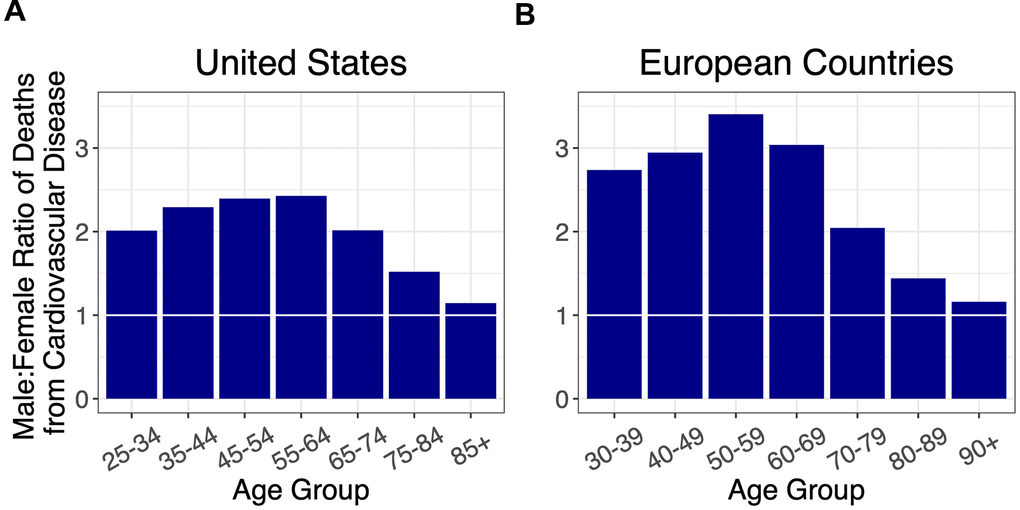
Figure 2.Ratios of male to female deaths from cardiovascular disease (adjusted for population sex distribution) for (A) the US, and (B) combined ratios for the European countries: Italy, France, Spain, Germany, and the Netherlands. A 1:1 ratio is indicated by white horizontal lines.