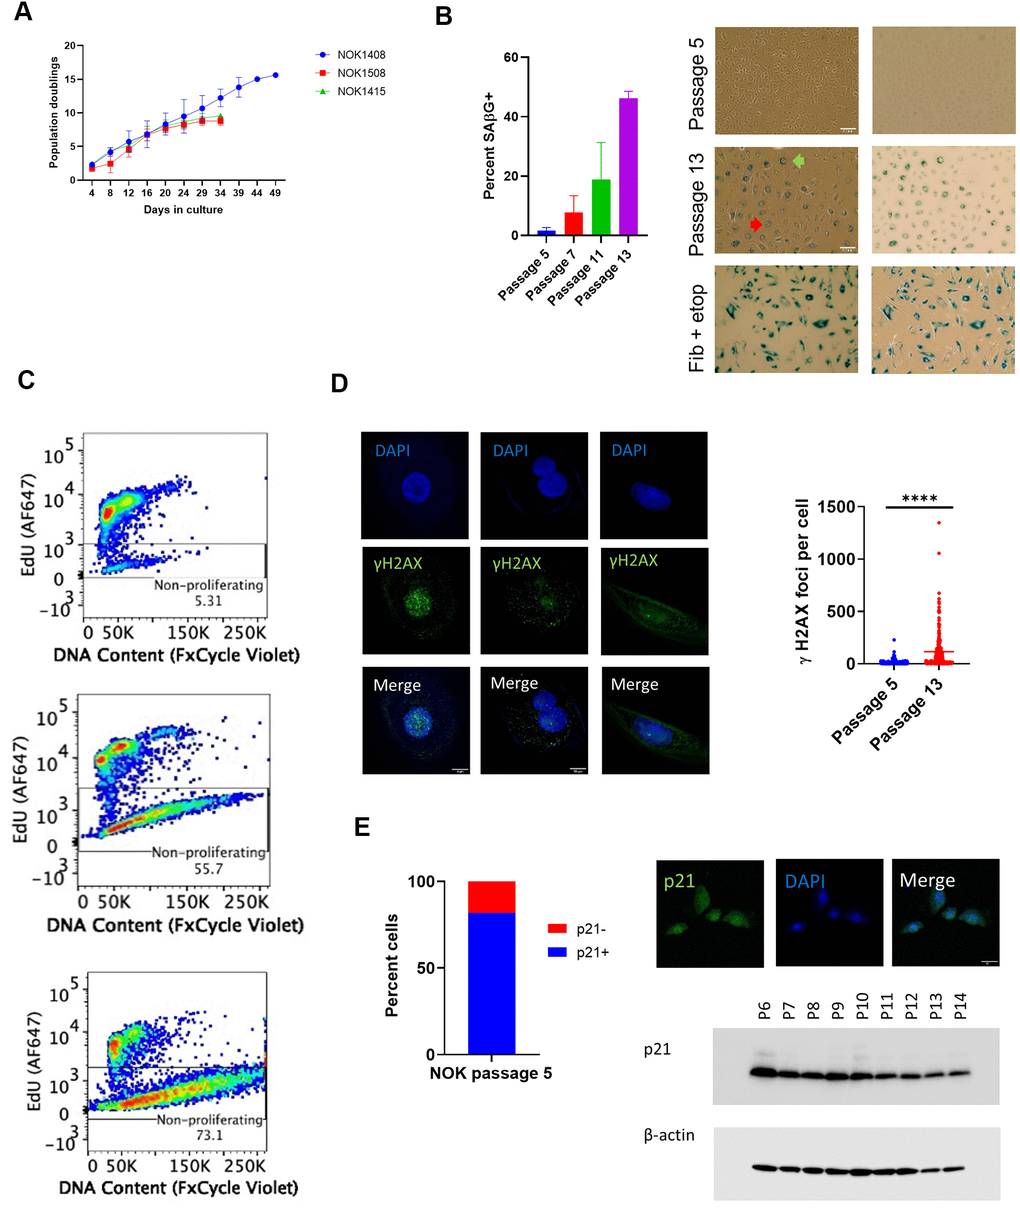
Figure 1.Indicia of senescence. (A) Population doubling. Y-axis is cumulative population doubling (PD) and X-axis is days in culture starting with passage 5. (Mean of 2 replicates per donor ± SD.) Cumulative PD = 3.322 x [log N(t) – log N(0)] + X, where N(0) is number of cells plated (5 x 10⁵), N(t) is number of cells at next passage, and X is PD for prior passages. (B) SAβG+ cells increased with passaging. (Top, passage 5; middle, passage 13, Donor 1415). (Mean ± SD.) Positive control (bottom) is etoposide-treated BJ fibroblasts. (Left, phase contrast; right, brightfield. 20x magnification.) Multinucleate cell, red arrow. Perinuclear vacuoles, green arrow. (C) Representative EdU flow cytometry results. (Donor 1415. Top, passage 5; middle, passage 10; bottom, last passage). (D) γH2AX IF. Staining shows significant increase (p < 0.0001, two-tailed t-test) in DSBs with passaging (Donors 1415 and 1408, combined), and binucleation and cytosolic foci in passage 13 cells (Donor 1415, left and center column images; Donor 1408, right column images). (E) Cells positive for p21WAF1/CIP1. Percent positive in nucleus at passage 5 (640 total cells from Donors 1408 and 1415). IF shows nuclear p21WAF1/CIP1 protein in passage 5 cells (Donor 1408). Immunoblot shows decline in p21WAF1/CIP1.