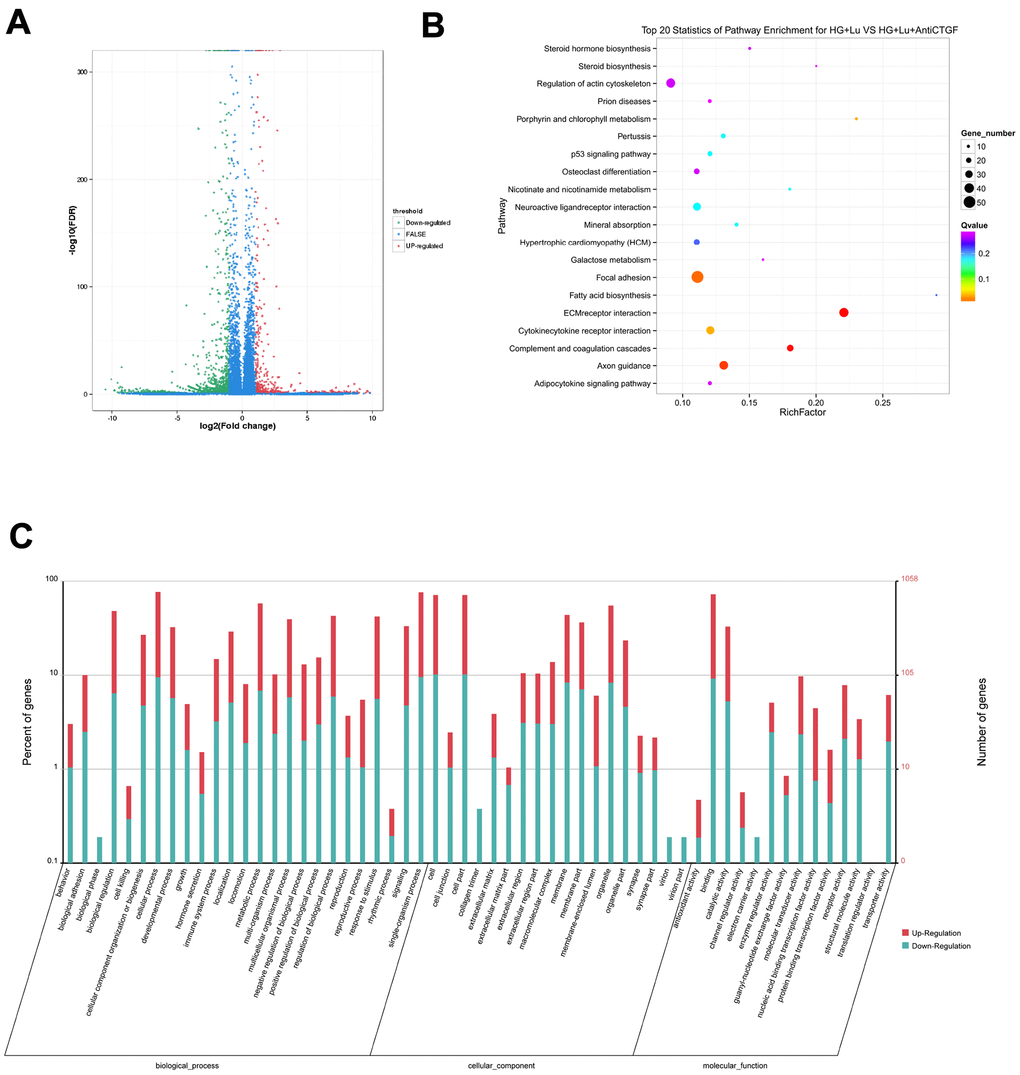
Figure 3.Differential gene analysis in the HG + Lu and HG + Lu + anti-CTGF groups. (A) A volcano map showed the differentially expressed genes in cell samples of the HG + Lu and HG + Lu + anti-CTGF groups. The blue dots indicate the genes whose expression was not significantly different between the two groups; the red dots indicate the significantly upregulated genes in the HG + Lu + anti-CTGF group as compared to HG + Lu group; the green dots refer to the significantly downregulated genes. (B) KEGG pathway analysis indicated the top 20 signaling pathways enriched by the differentially expressed genes in the HG + Lu and HG + Lu + anti-CTGF enrichment comparison. The x-axis represents the ratio of candidate genes to the background gene. The y-axis represents the GO terms. The color of the bubble corresponds to the enrichment (-log10 (P value)), and the size of the bubble is proportional to the number of genes enriched in the pathway. (C) HG + Lu and HG + Lu + anti-CTGF differential gene GO function annotation classification. The GO enrichment analysis revealed that the differentially expressed genes were enriched in biological processes, cellular components, and molecular functions. The x-axis represents differentially expressed genes in biological processes, cellular components, and molecular functions. The y-axis on the left represents the percentage of genes that are up- or downregulated, and the y-axis on the right represents the number of genes. Red represents upregulated genes, and blue represents downregulated genes.