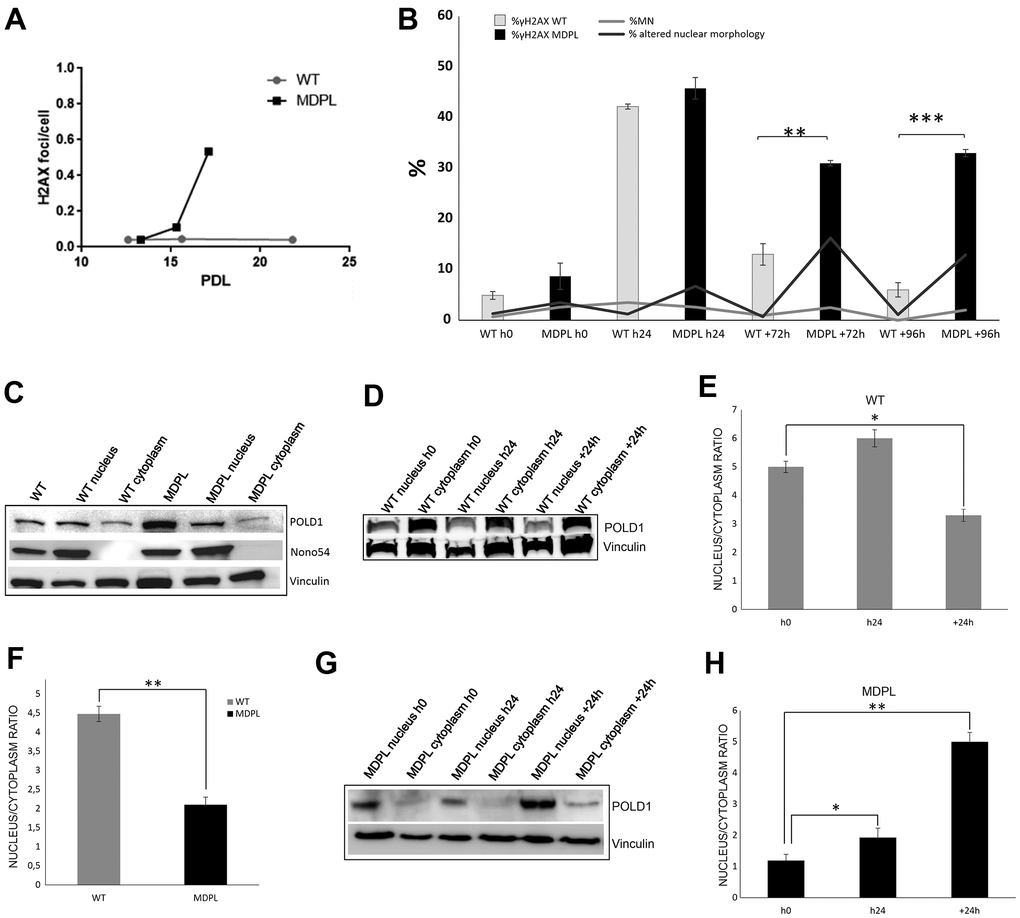
Figure 3.DNA repair and protein expression after cisplatin treatment. (A) γH2AX foci in fibroblasts at different population doubling levels (PDL). (B) The graph shows the trend of γH2A.X positive cells at each time point. Error bars represent the SD from the analysis of 100 cells from three independent experiments and WT values are displayed as the average percentages of 2 different controls. (**P<0.01, ***P< 0.001). The two lines show the trend of micronuclei (light grey line) and altered nuclear morphologies (dark grey line) in MDPL-HDFs compared to WT cells, at each time point after cisplatin treatment. The percentage of micronuclei is around 2.5% in MDPL-HDFs+72h, while it decreases to ~1% in WT cells+72h (*P<0.05). After further 24h (WT and MDPL-HDFs +96h) the percentage of MN remains around 2% in MDPL-HDFs, decreasing to 0% in WT-cells (*P<0.05). Also the difference between the percentage of altered nuclear morphology is statistically significant between WT and MDPL-HDFs both at +72h and +96h (**P<0,01); (C) Western blot analysis of Polδ from MDPL and WT HDFs and following nuclear cytoplasm fractionation. Nono54 was used to check the correct fractionation and Vinculin was used as control. (F) Densitometric Analysis of Polδ nucleus/cytoplasm ratio protein levels. (**P<0.01). Western blot analysis of equal amount of total proteins from WT (D, E) and MDPL-HDFs (G, H) at h0, h24 and +24h of cisplatin treatment and following nuclear cytoplasm fractionation. (*P<0.05, **P<0.01). Vinculin was used as control. Data are presented as means ± SD.