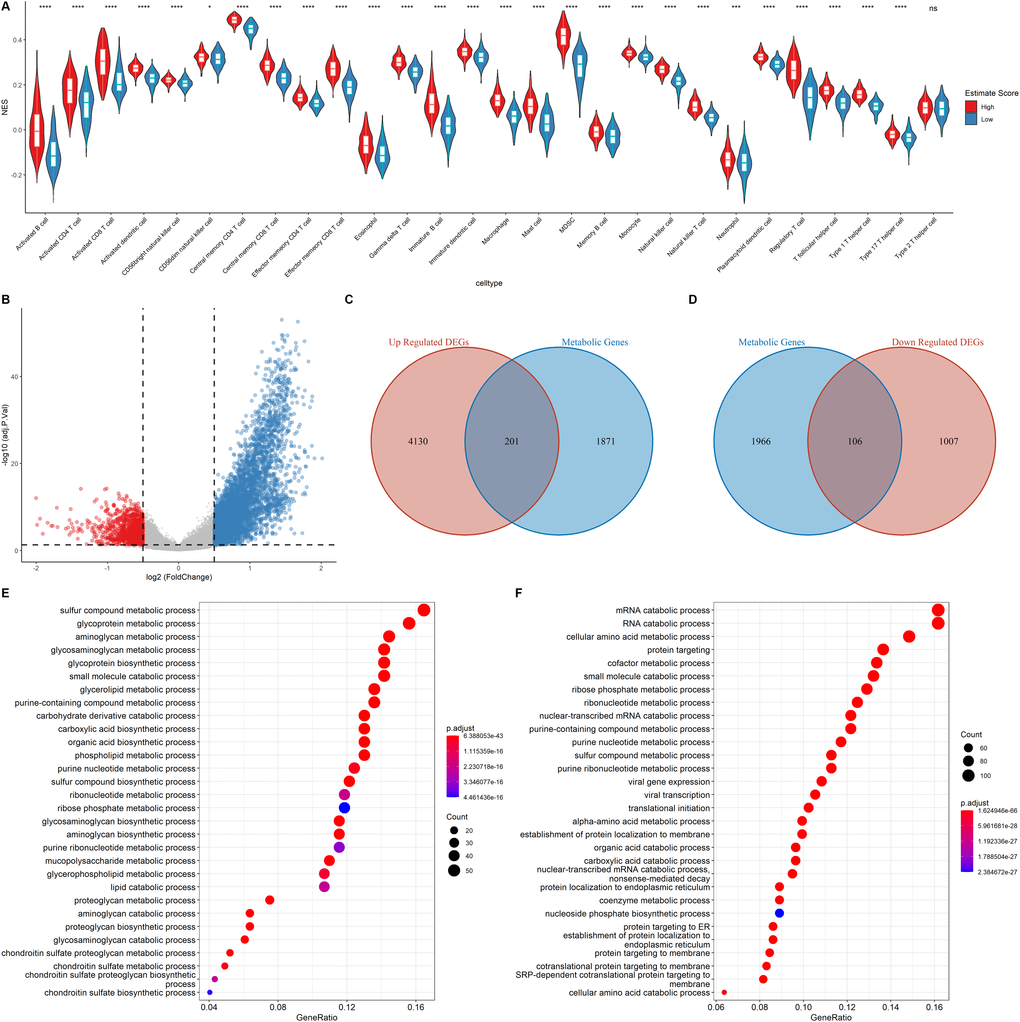
Figure 3.Functional annotation of the DEGs. (A) Correlation of Immune score and Immune cell score based on the ssGSEA algorithm (B) Volcano plot showing the DEGs. The criteria of the DEGs were set as |logFC| > 0.05 and adjusted p < 0.05. Red dots and blue dots represent genes that are significantly downregulated or upregulated, respectively. (C–D) Venn diagram showing the up regulated and down regulated metabolic DEGs. (E–F) GO analysis of up regulated genes and down regulated metabolic genes.