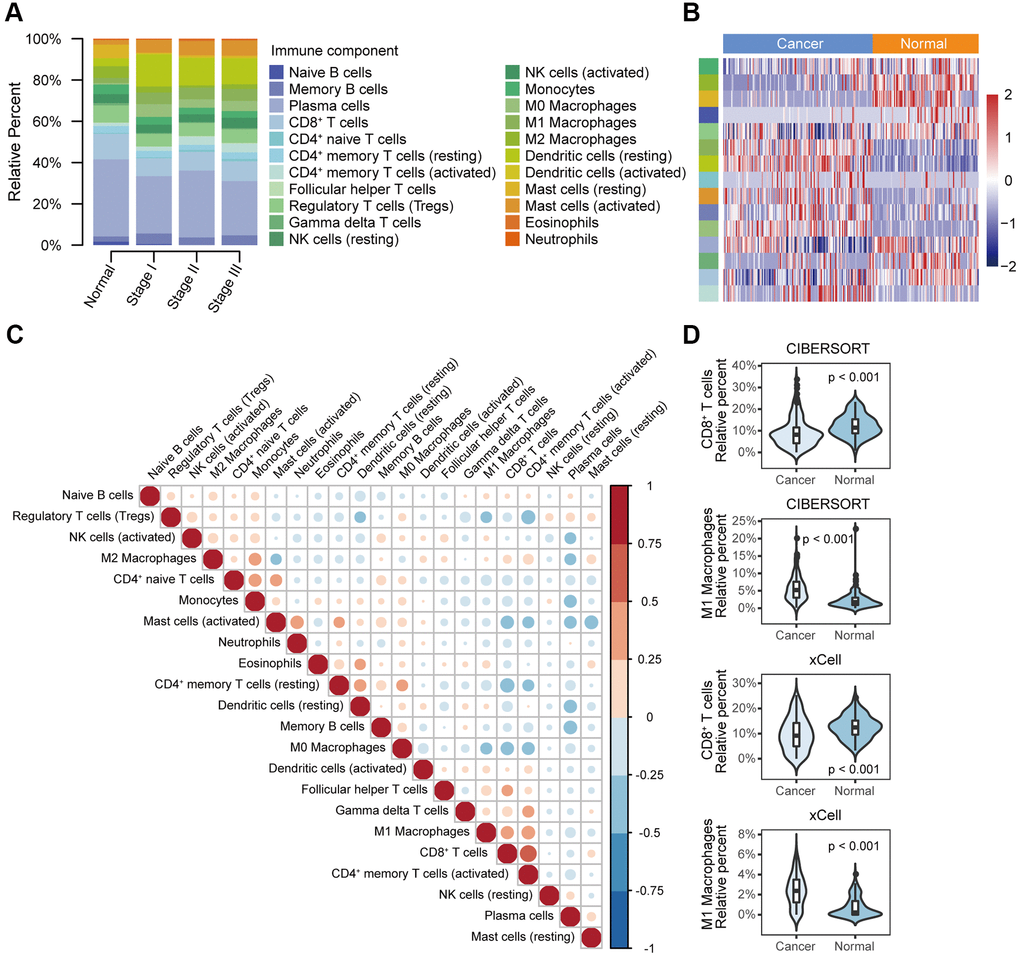
Figure 2.Different immune cell profiles between normal tissue and cancer tissue. (A) Relative immune cell fractions in the normal and cancer groups estimated with CIBERSORT based on gene expression profile data (GSE53625). (B) Heat map of differential immune cell fractions between the normal and cancer groups (FDR < 0.05). P values were calculated with the Mann–Whitney U test and adjusted for multiple testing (FDR). The left side bar shows the type of immune cells in A. (C) Correlation matrix of 22 immune cell types in the cancer group. Correlation coefficients were used to sort the cells by hierarchical clustering. (D) Violin plots of the abundance of CD8+ T cells and M1 macrophages calculated with CIBERSORT and xCell. The box plots in the violin indicate the median and interquartile range of the data distribution.