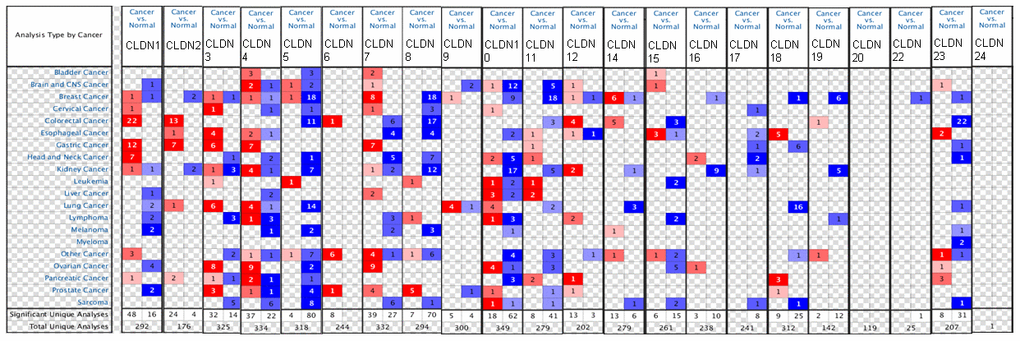
Figure 1.The mRNA expression of the claudin family in different types of cancers (ONCOMINE). Notes: The figure is generated from ONCOMINE with exact thresholds (p-value: 0.05; fold change: 2; gene rank: top 10%). The cell number represents the dataset number that meets all the thresholds, with blue for underexpression and red for overexpression. The cell color is determined by the best gene rank percentile for the analyses within the cell.