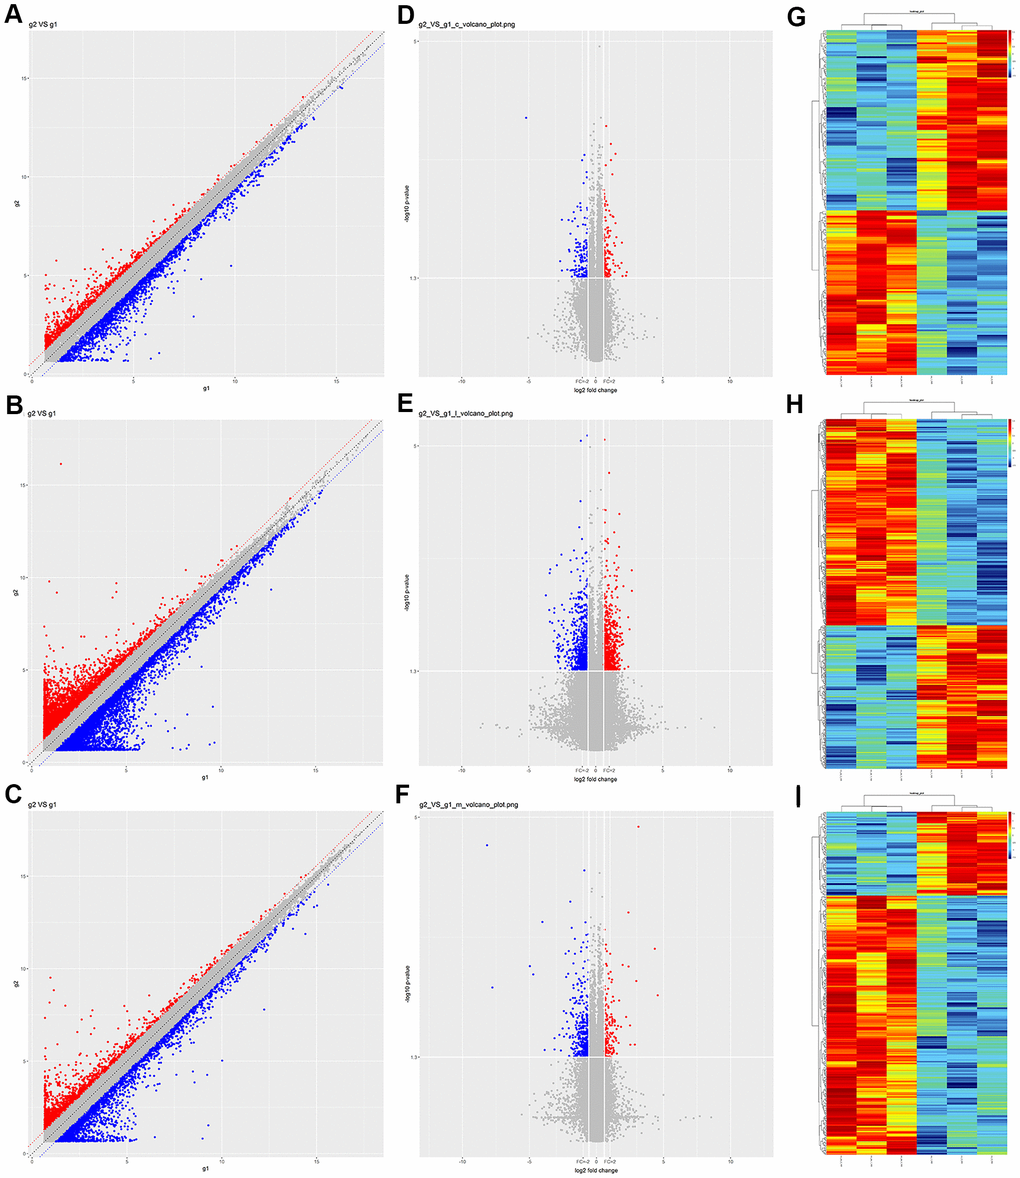
Figure 1.Expression profiles of circRNAs, lncRNAs and mRNAs in prefrontal cortex tissues from Nrf2 (-/-) and Nrf2 (+/+) mice. (A–C) Scatter plots showing the expression variation of circRNAs (A), lncRNAs (B) and mRNAs (C) between Nrf2 (-/-) and Nrf2 (+/+) prefrontal cortex tissues. The values of the X and Y axes in the scatter plots are the normalized signal values of the samples (log2-scaled). The red (up-regulated) and blue (down-regulated) points represent the DEcircRNAs (A), DElncRNAs (B) and DEmRNAs (C) with more than FCs > 1.5 between Nrf2 (-/-) and Nrf2 (+/+) prefrontal cortex tissues. (D–F) Volcano plots showing the differential expression of circRNAs (D), lncRNAs (E) and mRNAs (F) between Nrf2 (-/-) and Nrf2 (+/+) prefrontal cortex tissues. The vertical lines correspond to 1.5-fold upregulation and downregulation, and the horizontal line represents a p-value of 0.05. The red (up-regulated) and blue (down-regulated) points represent the DEcircRNAs (D), DElncRNAs (E) and DEmRNAs (F) with statistical significance. g1: group 1, refers to the Nrf2 (+/+) group. g2: group 2, refers to the Nrf2 (-/-) group. (G–I) Hierarchical clustering analyses were performed to depict the DEcircRANs (G), DElncRNAs (H) and DEmRNAs (I) in Nrf2 (-/-) prefrontal cortex compared with Nrf2 (+/+) prefrontal cortex tissues. The clustering analysis was used to group samples based on their expression values so that the relationships among samples could be predicted. ‘Red’ denotes high relative expression, and ‘green’ denotes low relative expression.