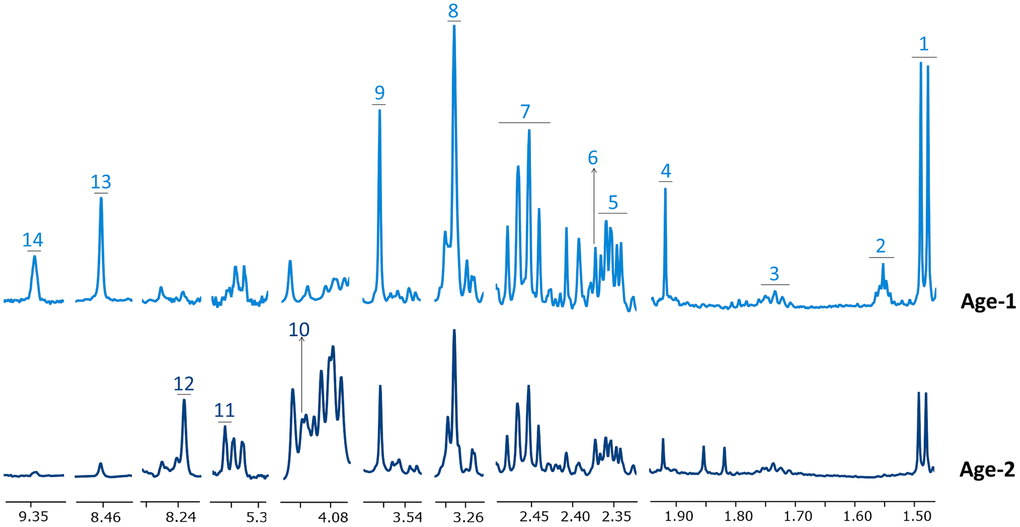
Figure 1.Representative 1H-NMR spectra corresponding to Age-1 and Age-2 groups. Spectral regions are widened to better appreciate changes in the levels of some metabolites. Metabolites in Age-1 and Age-2 spectra are negatively and positively associated with age, respectively. Assigned metabolites: 1 alanine, 2 adipate, 3 lysine, 4 acetate, 5 glutamate, 6 pyruvate, 7 glutamine, 8 betaine, 9 glycine, 10 6-phosphogluconate, 11 phosphoenolpyruvate, 12 inosine monophosphate, 13 formate, 14 NAD+.