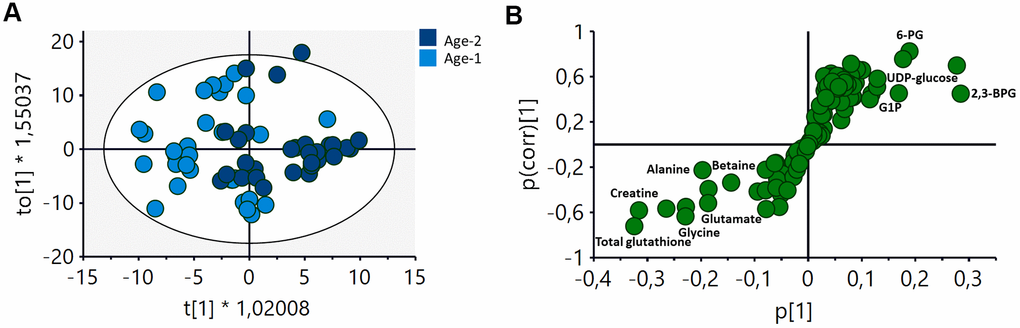
Figure 2.OPLS-DA analysis of the metabolomic profile of RBCs of Age-1 (≤45 years) and Age-2 (>45 years) groups. (A) Score plot of the OPLS-DA model obtained. R2Y(cum)=0,675, Q2(cum)=0.208. Permutation test result: R2=(0.0, 0.249), Q2=(0.0, -0.276). CV-Anova: p-value=0.0388. (B) S-plot showing the most important metabolites contributing to the discrimination between the Age-1 and Age-2 groups. 2,3-BPG: 2,3-biphosphglycerate, 6-PG: 6-phosphogluconate, G1P: glucose 1-phosphate.