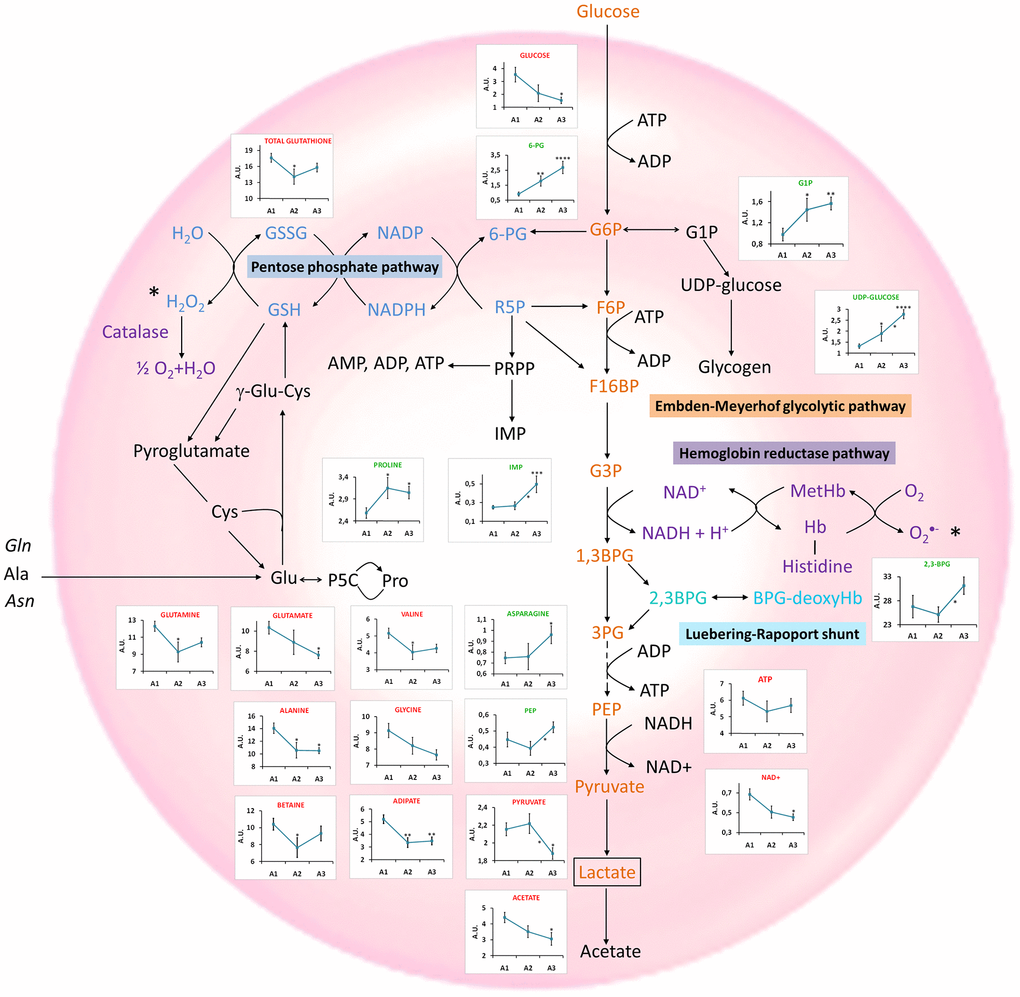
Figure 3.Main metabolomic pathways found in RBCs and summary of the most relevant age-associated metabolic alterations. Concentration values are normalized to total intensity. A1=between 19 and 40 years, A2 = between 40 and 60 years; and A3≥60years. Values are represented as mean±SEM. * p < 0.05, ** p < 0.01, *** p < 0.001, **** p < 0.0001. P-values were calculated with a Student’s t-test. 1,3BPG: 1,3-biphosphoglycerate, 2,3BPG: 2,3-biphosphoglycerate, 3PG: 3-phosphoglycerate, 6-PG: 6-phosphogluconate, ADP: adenosine diphosphate, Ala: alanine, Asn: Asparagine, ATP: adenosine triphosphate, BPG-deoxyHb: biphosphoglycerate-deoxyhemoglobin, Cys: cysteine, F6P: fructose 6-phosphate, F16BP: fructose 1,6-biphosphate, G6P: glucose 6-phosphate, G1P: glucose 1-phoshate, G3P: Glyceraldehyde 3-phosphate, Glu: glutamate, Gln: glutamine, GSH: reduced glutathione, GSSG: oxidized glutathione, IMP: inosine monophosphate, MetHb: methaemoglobin, NAD+: Nicotinamide adenine dinucleotide, NADP+: Nicotinamide adenine dinucleotide phosphate, P5C: 1-pyrroline-5-carboxylate, PEP: phosphoenopyruvate, Pro: proline, PRPP: phosphoribosyl pirophosphate, R-5-P: ribose 5-phosphate.