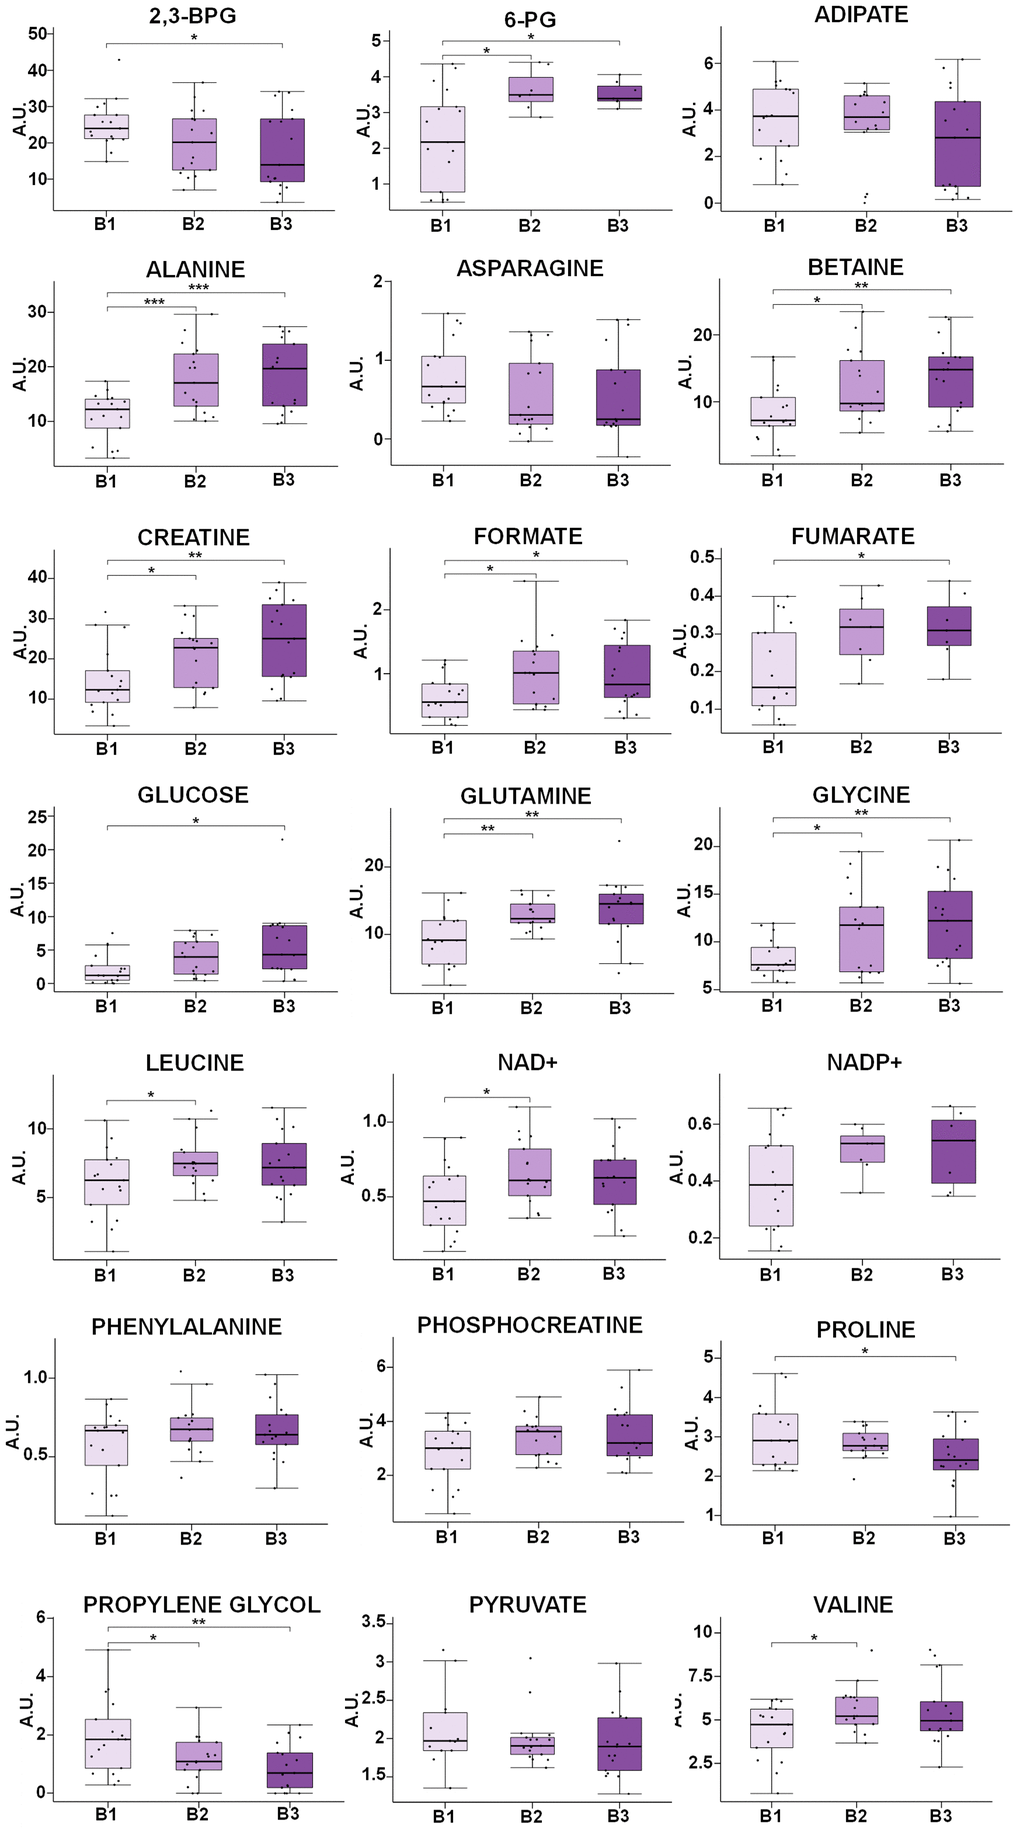
Figure 5.Box-plot comparison of the concentrations associated with the most relevant metabolites involved in the discrimination based on the BMI value. Metabolites that do not present statistically significant changes, but show clear trends with BMI, has been also included (NADP+, phenylalanine, phosphocreatine, asparagine). Concentration values are normalized to total intensity. Values are represented as mean±SEM. * p < 0.05, ** p < 0.01, *** p < 0.001. P-values were calculated with a Student’s t-test. For each box, the central line is the median, the edges of the box are the upper and lower quartiles, the whiskers extend the box by a further ±1.5 interquartile range (IQR) and outliers are plotted as individual points. 6-PG: 6-phosphogluconate, NAD+: Nicotinamide adenine dinucleotide NADP+: Nicotinamide adenine dinucleotide phosphate, 2,3-BPG: 2,3-biphosphoglycerate, G1P: Glucose 1-phosphate.