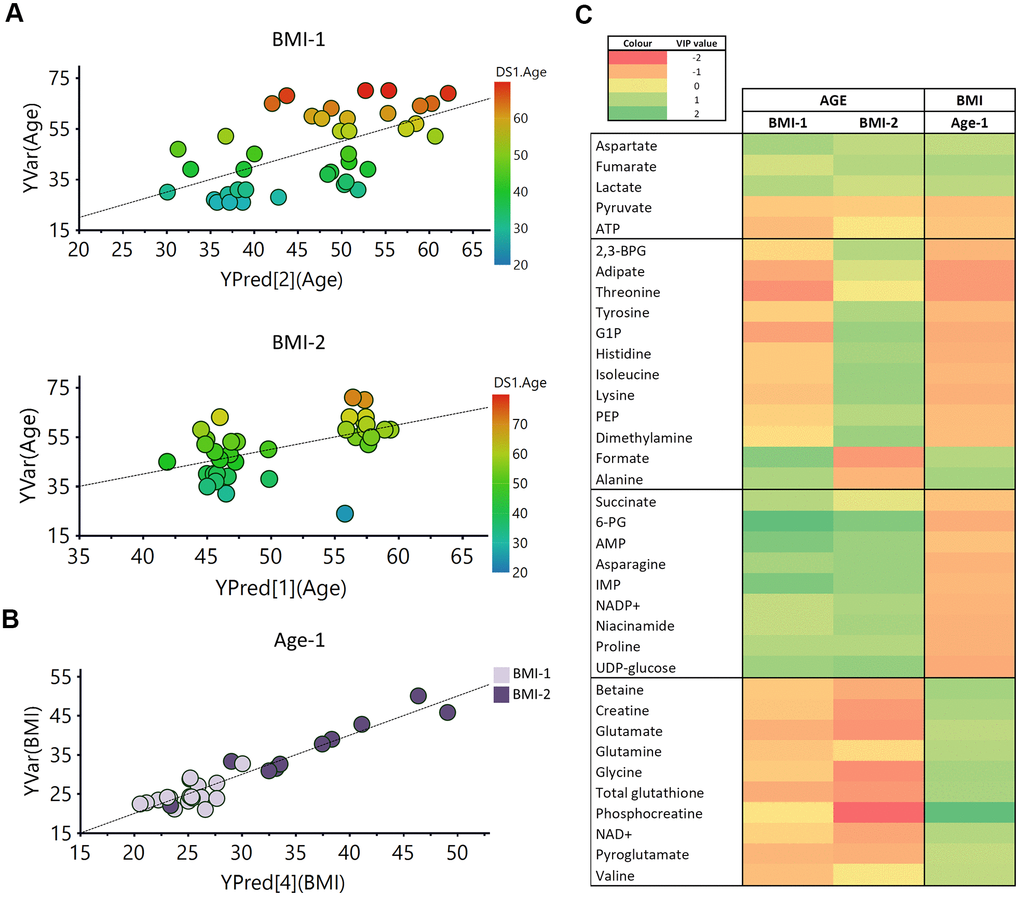
Figure 7.PLS analysis vs age and BMI. (A) PLS model vs age in BMI-1 group (BMI<30; R2Y(cum)= 0.355, Q2(cum)=0.207), Permutation test result: R2=(0.0, 0.261), Q2=(0.0, -0.162), p from CV-ANOVA =0.084) and in BMI-2 subjects (BMI≥30; R2Y(cum)= 0.294, Q2(cum)=0.185), Permutation test result: R2=(0.0, 0.149), Q2=(0.0,-0.0799), p from CV-ANOVA =0.038). (B) PLS model vs BMI for Age-1 individuals. R2Y(cum)= 0.9, Q2(cum)= 0.649, p= 0.00036, Permutation test result: R2=(0.0, 0.647), Q2=(0.0,-0.286), p from CV-ANOVA =0.0041 (C) Heatmap representation of the metabolites with variable importance in projection (VIP) values > 1 of the PLS regression models vs age or BMI. 2,3-BPG: 2,3-biphoshoglycerate, 6-PG: 6-phosphogluconate, AMP: adenosine monophosphate, ATP: adenosine triphosphate, G1P: glucose 1-phosphate, IMP: inosine monophosphate, NAD+: Nicotinamide adenine dinucleotide, PEP: phosphoenolpyruvate.