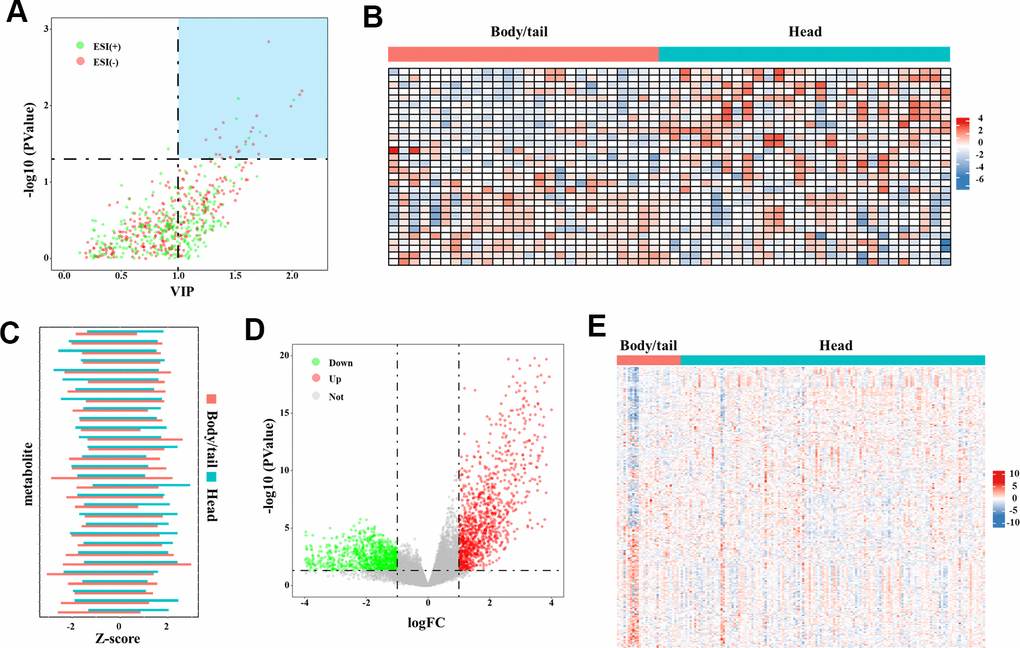
Figure 3.The DEM and DMG identified in the metabolome and transcriptome data. (A) The volcano plot of DEM denoted the selection of DEM (n=30), with VIP values >1 and p-value <0.05 provided from the t-test. The blue block in upper-right represented the selected DEM. (B) The heatmap (30◊60) depicted the Z-score of 30 DEM in metabolome analysis with log transformation, by setting body/tail cancers as referenced (n=30 for each group). (C) The bar chart depicted the direct comparison for each metabolite between pancreatic head and body/neck cancer. The Z-score with log transformation was presented. (D) Genes in the transcriptome analysis were presented in the volcano plot. By setting the fold-change >1 and p-value <0.05 as threshold, differential genes were depicted. The green point represented the downregulated genes (n=579) and the red points represented the upregulated genes (n=1,004). (E) The heatmap (247◊167) depicted the Z-score of DMG levels with log transformation, by setting body/tail cancers as referenced (n=138 for head group, and n=29 for body/tail group).