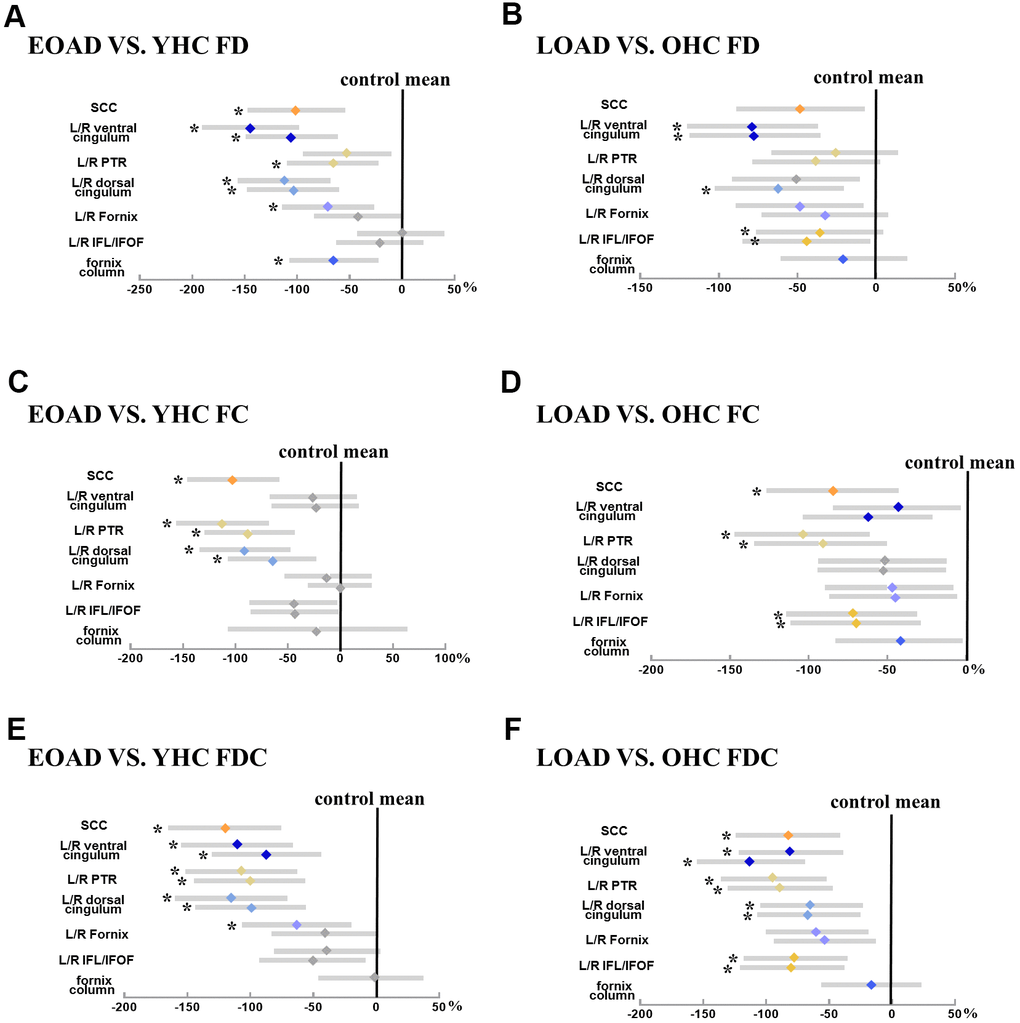
Figure 2.Illustrates the group difference (patient VS. control) in mean FD, FC, and FDC based on the ZJU database. (A, C, E) Represents the mean FD, FC, and FDC (diamond) and 95% CI (bars) within tracts of interest are displayed for early-onset Alzheimer's disease groups, respectively; (B, D, F) represents the mean FD, FC, and FDC (diamond) and 95% CI (bars) within tracts of interest are displayed for late-onset Alzheimer's disease groups, respectively. The more the color bar shifted to the left, representing more significant difference from healthy controls. Notably, significant tracts (Bonferroni-corrected P-value < 0.05, controlling for age and sex) are marked with star symbols. Abbreviation: SCC, splenium of the corpus callosum; ILF/IFOF, inferior longitudinal fasciculus/inferior frontal-occipital fasciculus; PTR, posterior thalamic radiation; HP, hippocampus; FD, fiber density; FC, fiber bundle cross-section; FDC, fiber density and cross-section.