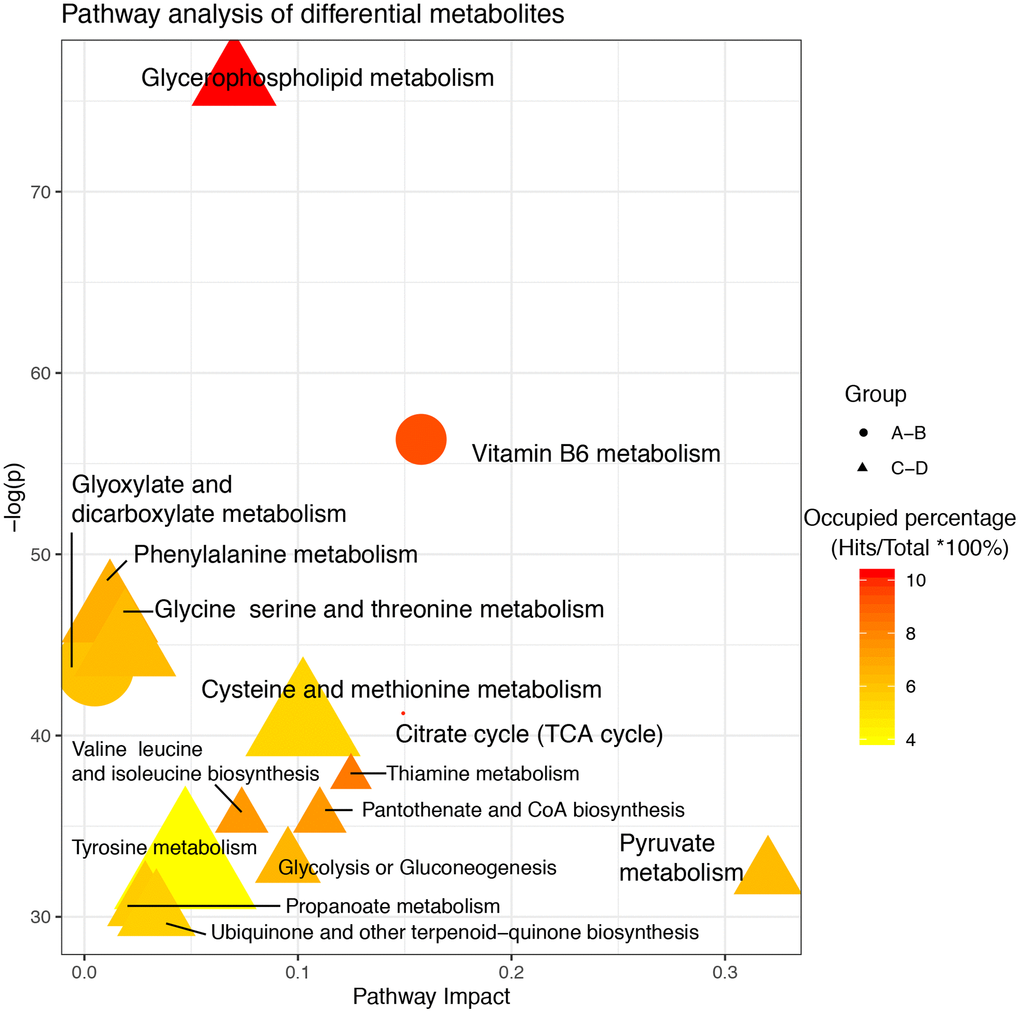
Figure 3.Pathway analysis of altered metabolites isolated from patients with delayed and enhanced postoperative recovery in the PACU and at 24 h after surgery. The X-axis represents the pathway impact, and the Y-axis represents the –log (p). Node size indicates metabolites in a specific pathway, and colors indicate the occupied percentage (the hit metabolites occupying a percentage of all metabolites in the whole pathway). Yellow to red represents high to low. The shapes of the nodes represent differential metabolites in different groups. Round represents differential metabolites between A and B; Triangle represents differential metabolites between C and D.