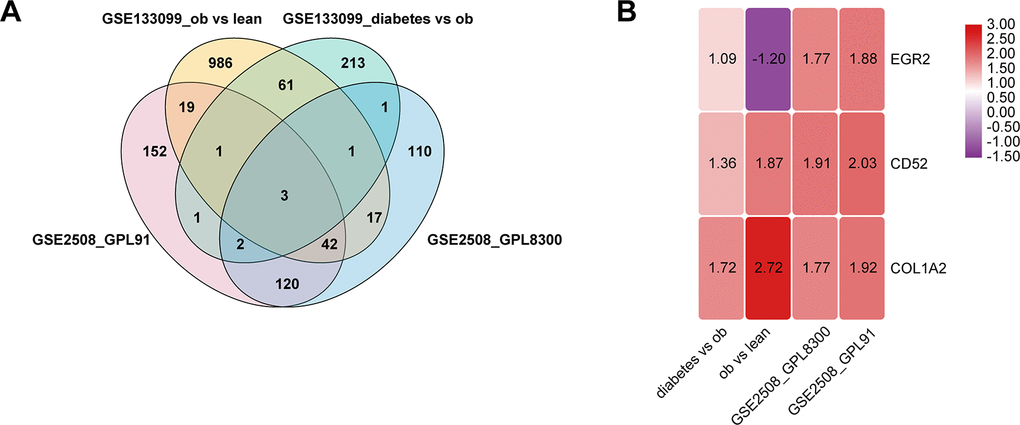
Figure 1.Identification of differentially expressed genes in mature adipocytes. (A) Venn diagram of the differentially expressed genes in 4 pairs group. (B) There are three genes that are significantly differentially expressed in all four groups, and the number in the rectangle represents logFC.