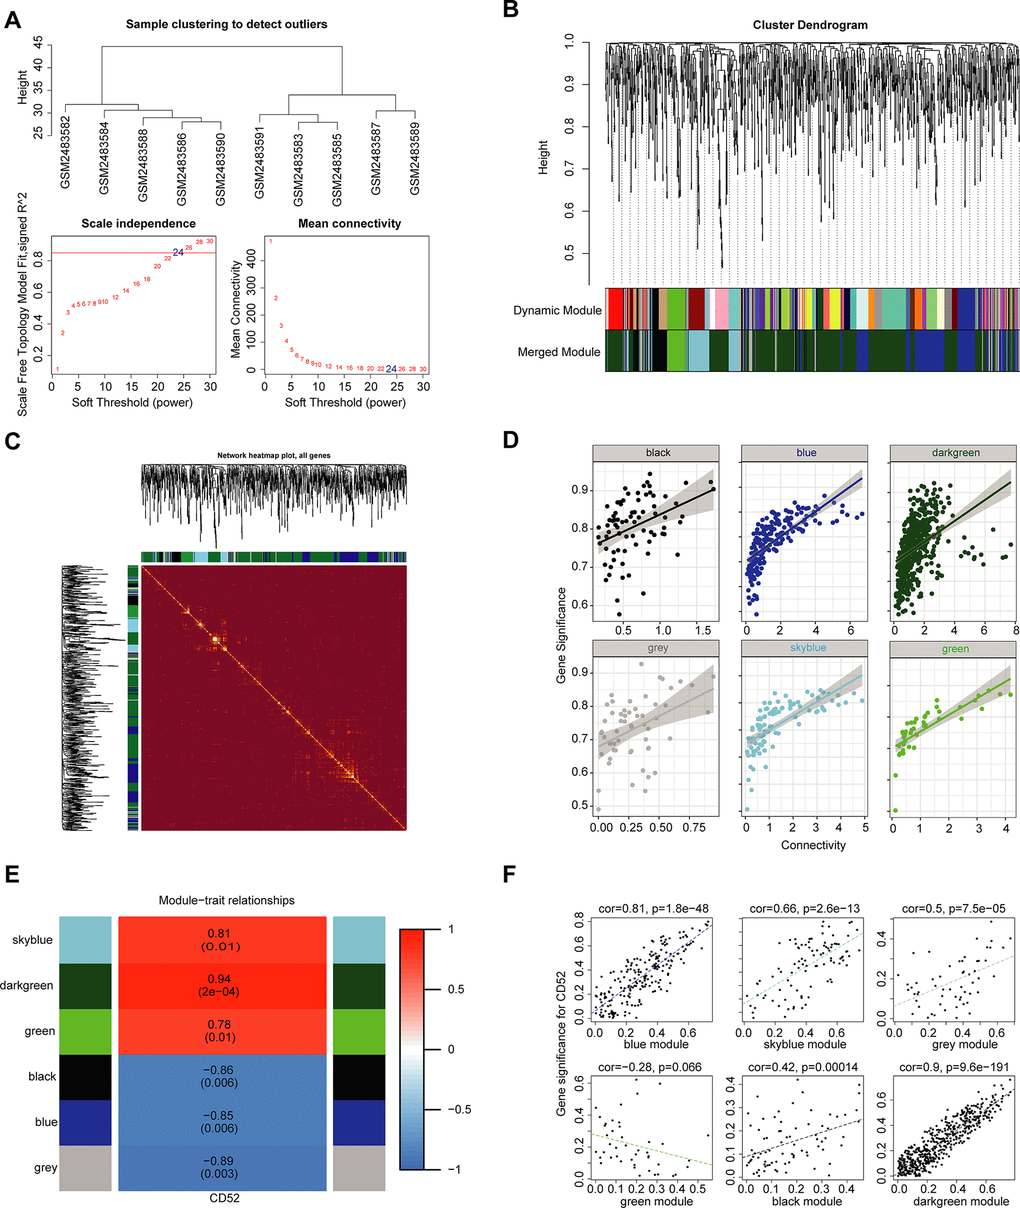
Figure 5.WGCNA. (A) Analysis of the scale-free topology model fit index for various soft-thresholding powers (β) and the mean connectivity for various soft-thresholding powers. Overall, 24 was the best fitting power value. (B) Dendrogram of the gene modules based on a dissimilarity measure. The branches of the cluster dendrogram correspond to the different gene modules. Each piece of the leaves on the cluster dendrogram corresponds to a gene. (C) TOM Diagram of Gene clustering and Module relationship in each Module of WGCNA. (D) The relationship between intra-module connectivity and gene significance in each module of WGCNA. (E) Module-trait relationships. Heatmap of the correlation between module eigengenes and expression of CD52. (F) The relationship between each module and clinical features. The horizontal axis represents the correlation coefficient between gene expression and module, and the vertical axis represents the correlation coefficient between gene expression and phenotype.