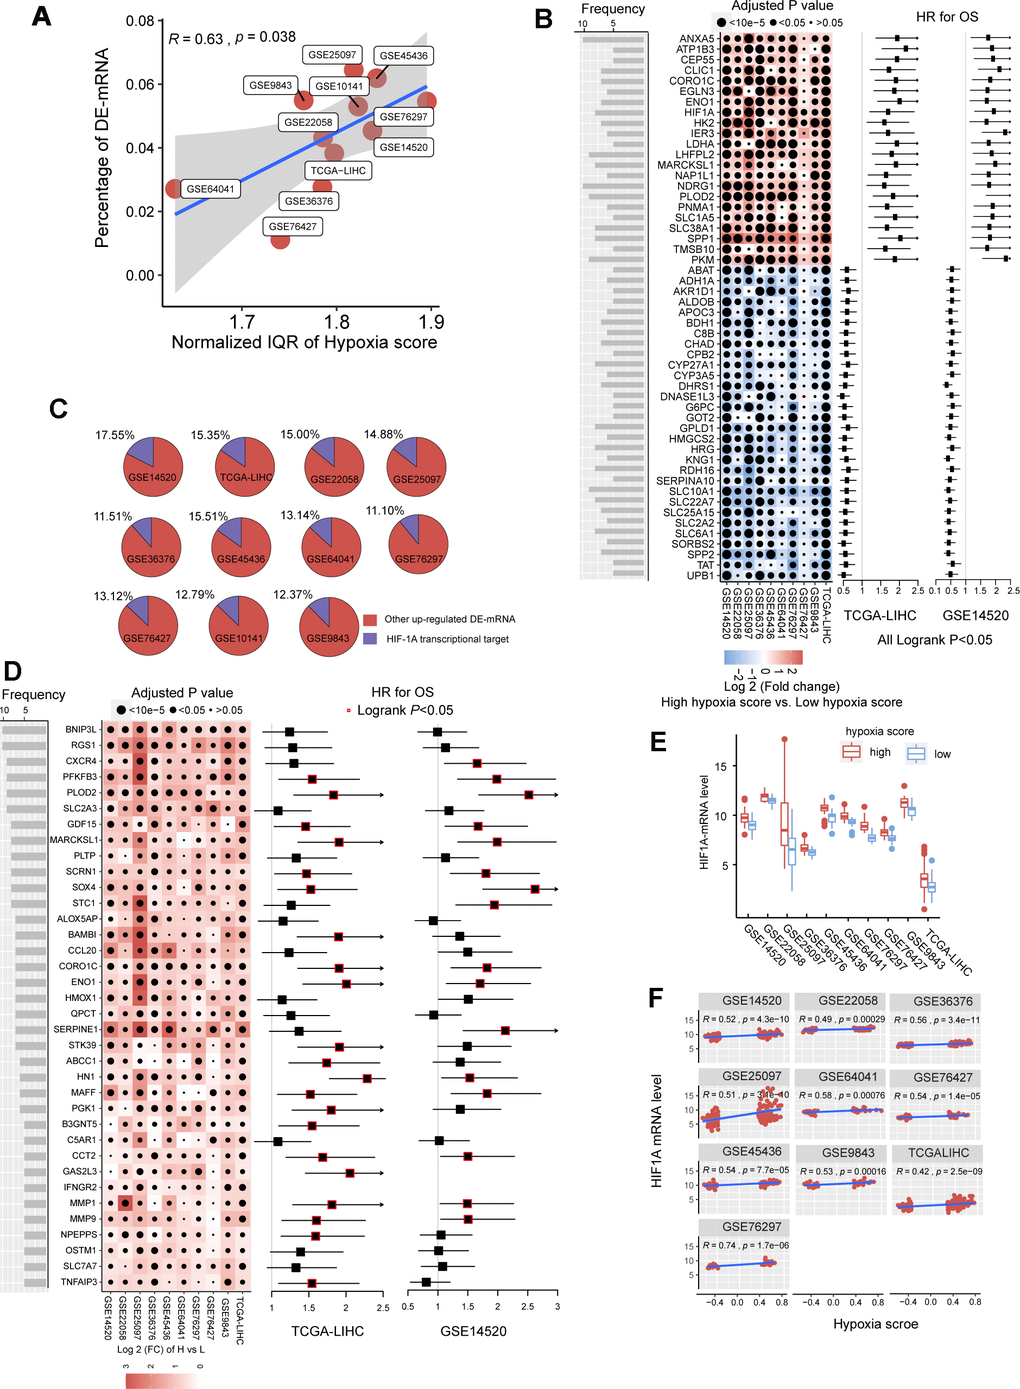
Figure 1.The mRNA alterations in hepatocellular carcinoma (HCC) patients with high hypoxia scores and low hypoxia scores. (A) Hypoxia scores were calculated based on the 21-gene hypoxia signature. According to the upper quartile and the lower quartile, patients were divided into a high hypoxia score group and a low hypoxia score group. In the 11 HCC cohorts, the percentage of differentially expressed (DE)-mRNAs among all mRNAs measured was positively proportional to the interquartile range (IQR) of the hypoxia scores. (B) A total of 51 high frequency/DE-mRNAs (HF/DE-mRNAs) are correlated to HCC patient survival in both TCGA-LIHC and GSE14520. The heat map shows the difference in the expression of these mRNAs between the high hypoxia score group and the low hypoxia score group in the 10 HCC cohorts, that is, the log2 (fold change) between the two groups. The forest plot indicates the hazard ratios (HRs) of these mRNAs for OS in the survival analysis (all logrank P < 0.01, HR < 0.7 or > 1.3, cut-off value = median expression level). (C) The percentage of transcription targets with differentially expressed hypoxia-inducible factor 1-alpha (HIF-1A) in a dataset for all DE-mRNAs in the dataset. (D) Thirty-six mRNAs may function as transcription targets of HIF-1A, and the upregulation trends are consistent in the 10 HCC datasets. The heat map shows the difference in the expression of these mRNAs between the high hypoxia score group and the low hypoxia score group. The forest plot indicates the HRs of these mRNAs for OS in the survival analysis (cut-off = median expression level). (E) The differences in HIF-1A mRNA expression levels between the high hypoxia score group and the low hypoxia score group in 10 HCC datasets. (F) Correlations between HIF-1A mRNA expression levels and hypoxia scores for the 10 HCC datasets.