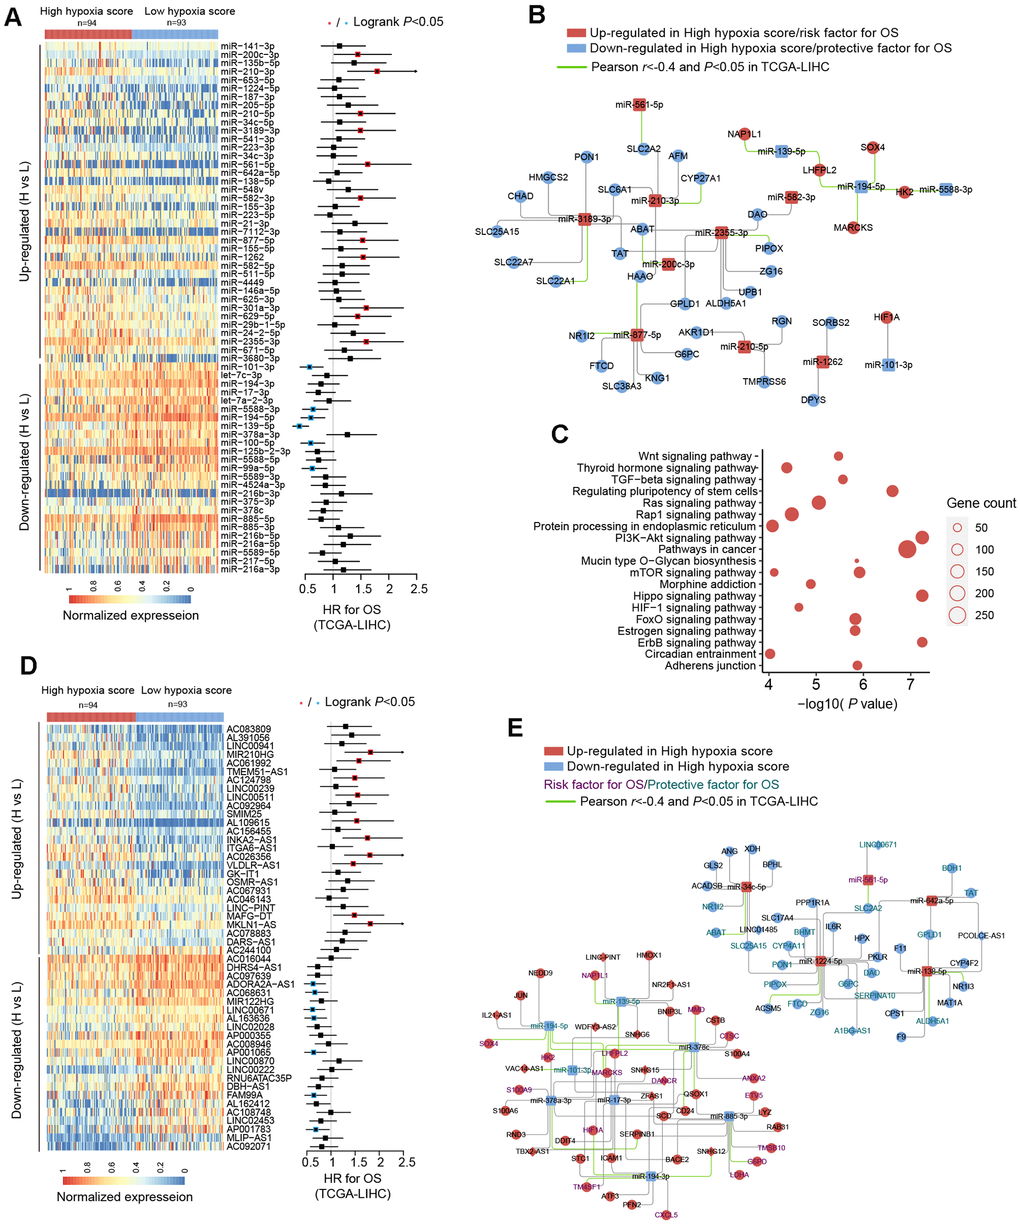
Figure 3.miRNA and long non-coding RNA (lncRNA) alterations in HCC patients with high hypoxia scores and low hypoxia scores. (A) A total of 63 DE-miRNAs were significantly upregulated or downregulated in the high hypoxia score group. The forest plot indicates the hazard ratios (HRs) of these miRNAs for overall survival (OS) in the survival analysis (logrank test). (B) Some DE-miRNAs and HF/DE-mRNAs constitute a survival-related target interaction network. All nodes in the network are correlated with HCC patient survival in TCGA-LIHC (logrank P < 0.05, cut-off = median expression level). The correlations between the nodes were calculated using Pearson correlation analysis. (C) Top 20 (sorted by P-value) KEGG pathway enrichment analysis results from 633 DE-miRNA target genes. (D) Top 50 (sorted by adjusted P-value) DE-lncRNAs that were significantly upregulated or downregulated in the high hypoxia score group. The forest plot indicates the hazard ratios (HRs) of these lncRNAs for OS in the survival analysis (logrank test). (E) The refined DE-lncRNA–DE-miRNA–HF/DE-mRNA ceRNA network. The correlations between nodes were calculated by Pearson correlation analysis. The survival data were from TCGA-LIHC. The cut-off is the median expression level.