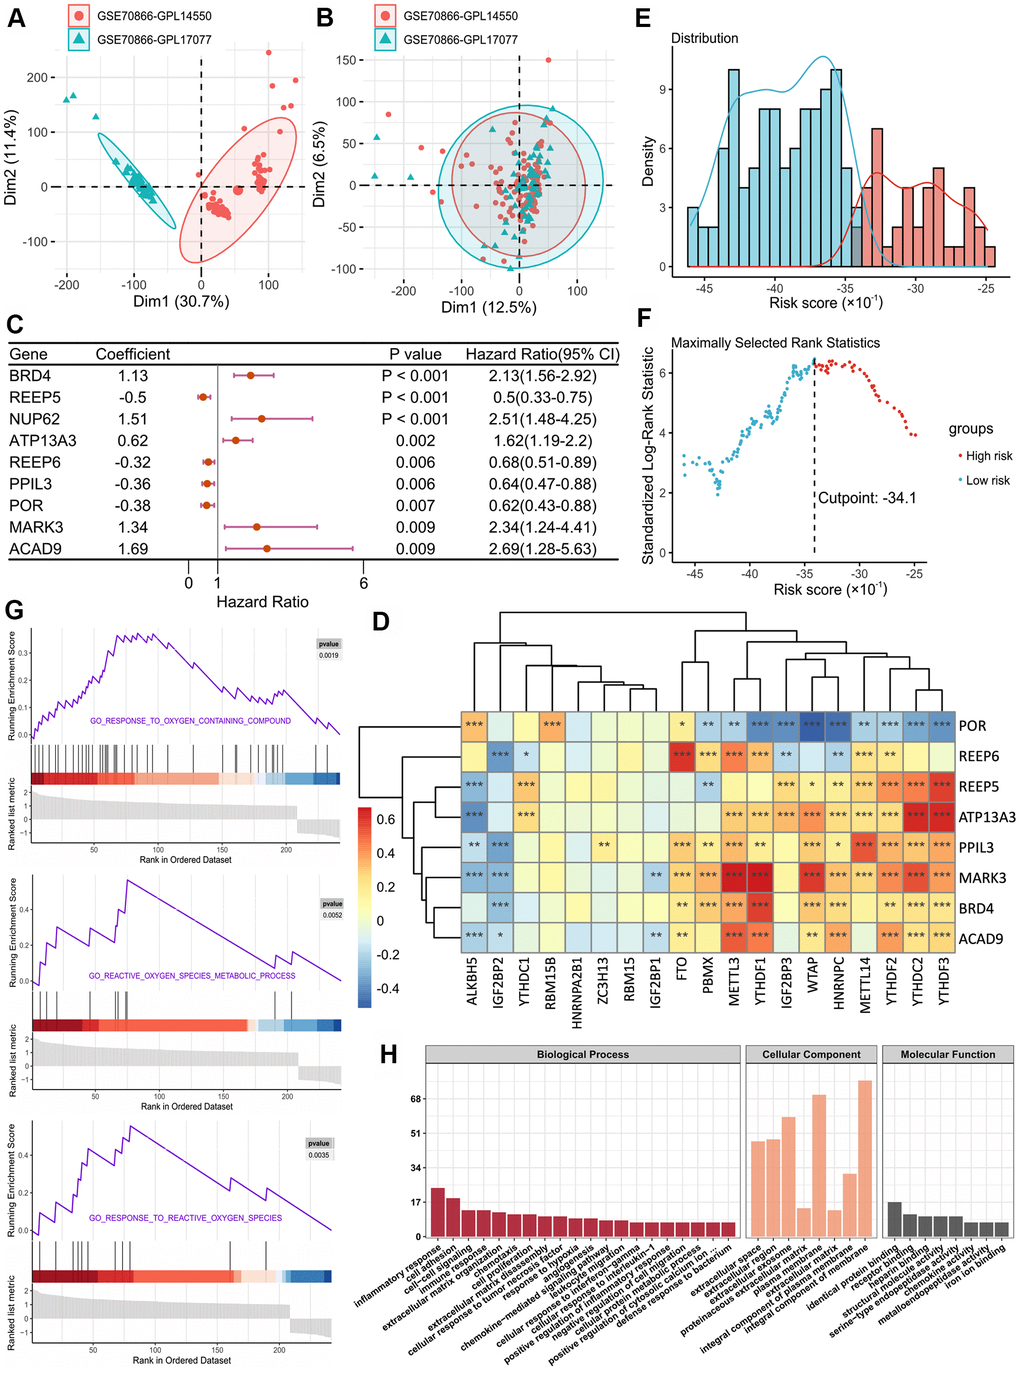
Figure 1.(A, B) Eliminating the batch effect between different sequencing platforms. (A) is the principal component analysis (PCA) plot before elimination of the batch effect, and (B) is the PCA plot after elimination. (C) Forest plot of 9 DEGs with P < 0.01 by univariate Cox regression. (D) The correlations between the m6A-related genes and 8 m6A-related-CoV genes. (E) Histogram based on maximally selected rank grouping. (F) The cut-off point with the maximum standard log-rank statistic was marked with a vertical dashed line. (G) The plots of GSEA results. (H) GO enrichment analysis of risk DEGs.