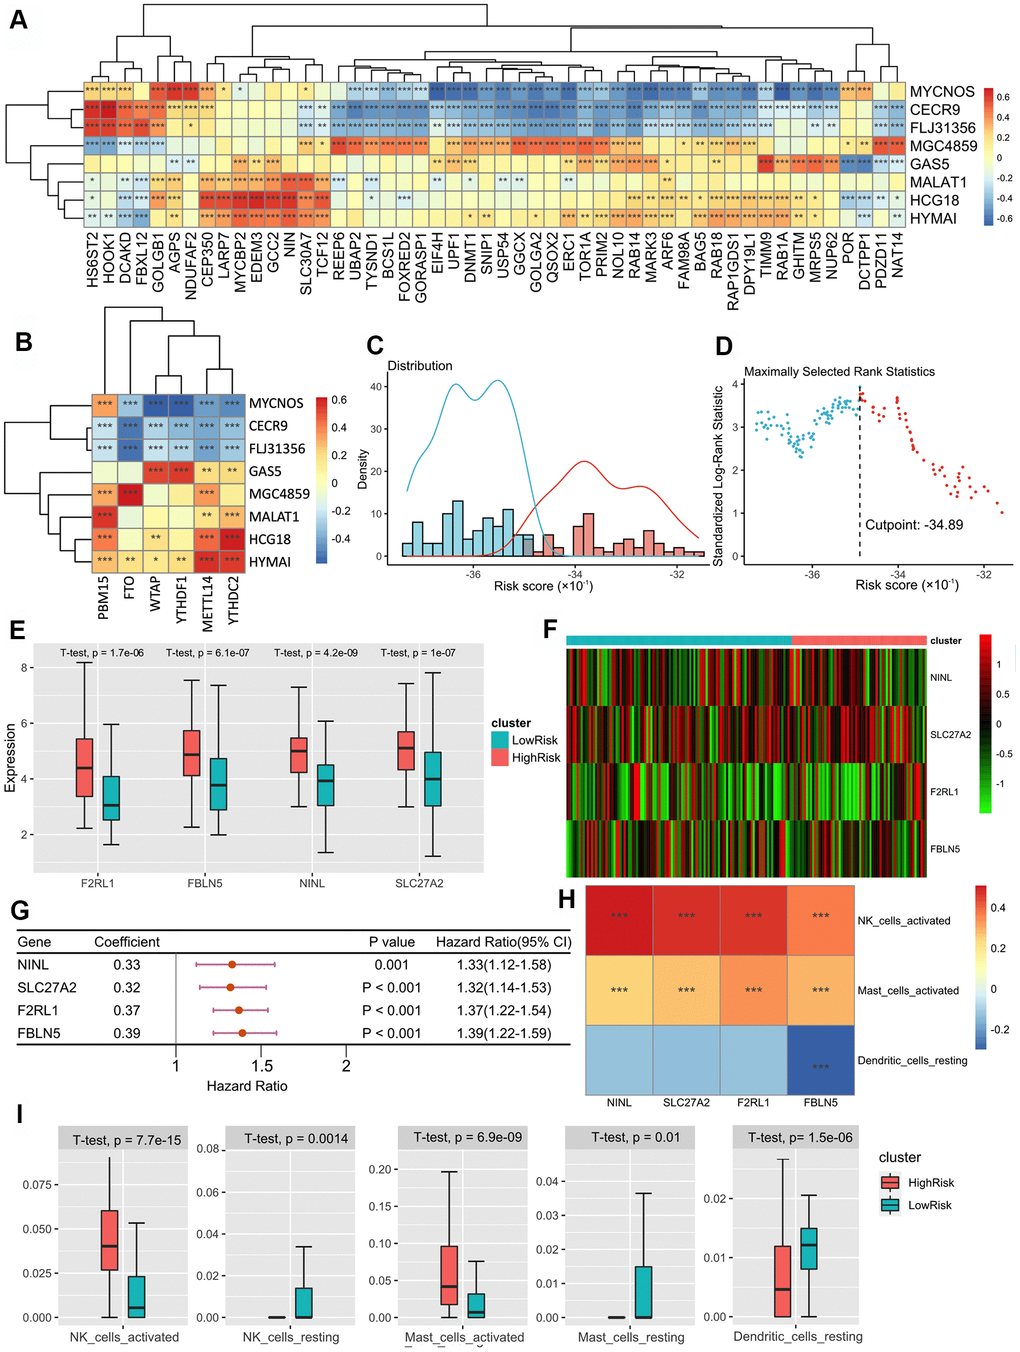
Figure 2.(A) The heatmap of the correlations between the lncRNAs and SARS-CoV-2 related genes. (B) The heatmap of correlations between the lncRNAs and m6A related genes. (C) Histogram based on maximally selected rank grouping. (D) The cut-off point with the maximum standard log-rank statistic was marked with a vertical dashed line. (E) The box plot showed the difference of F2RL1, FBLN5, NINL and SLC27C between low-risk group and high-risk groups. (F) The expression profiles of DEGs between the low-risk group and high-risk groups. (G) Forest plot of 9 DEGs with P < 0.01 by univariate Cox regression. (H) The heatmap of the correlations between three DEGs and 4 immune cells. (I) The box plot showed the significant difference of the immune cell infiltration between two groups.