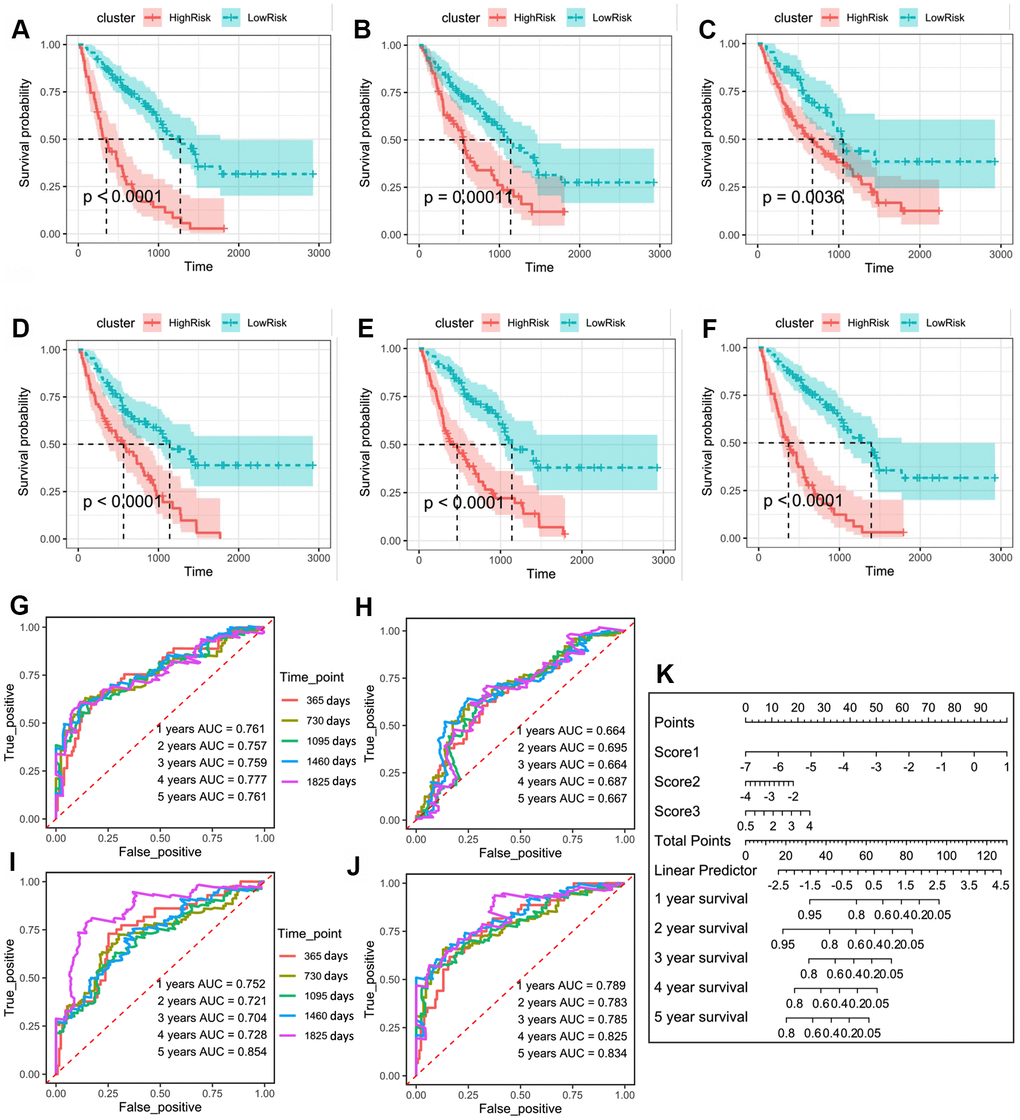
Figure 3.(A) Kaplan–Meier plot of overall survival in two clusters based on the risk models of m6A-related-CoV genes (Score 1). (B) Kaplan–Meier plot of overall survival in two clusters based on the risk models of m6A-CoV related lncRNAs (Score 2). (C) Kaplan–Meier plot of overall survival in two clusters based on the risk models of ESTIMATE immune score. (D) Kaplan–Meier plot of overall survival in two clusters based on the risk models of 3 immune cells’ infiltration. (E) Kaplan–Meier plot of overall survival in two clusters based on the risk models of SARS-CoV-2 related immune infiltration patterns (Score 3). (F) Kaplan–Meier plot of overall survival in two clusters based on the risk models of the combined Cox regression model. (G) The ROC curve in the risk models of m6A-related-CoV genes (Score 1). (H) The ROC curve in the risk models of m6A-CoV related lncRNAs (Score 2). (I) The ROC curve in the risk models of SARS-CoV-2 related immune infiltration patterns (Score 3). (J) The ROC curve in the risk models of the combined Cox regression model. (K) The nomogram for the 1–5-year overall survival based on the combined Cox regression model.