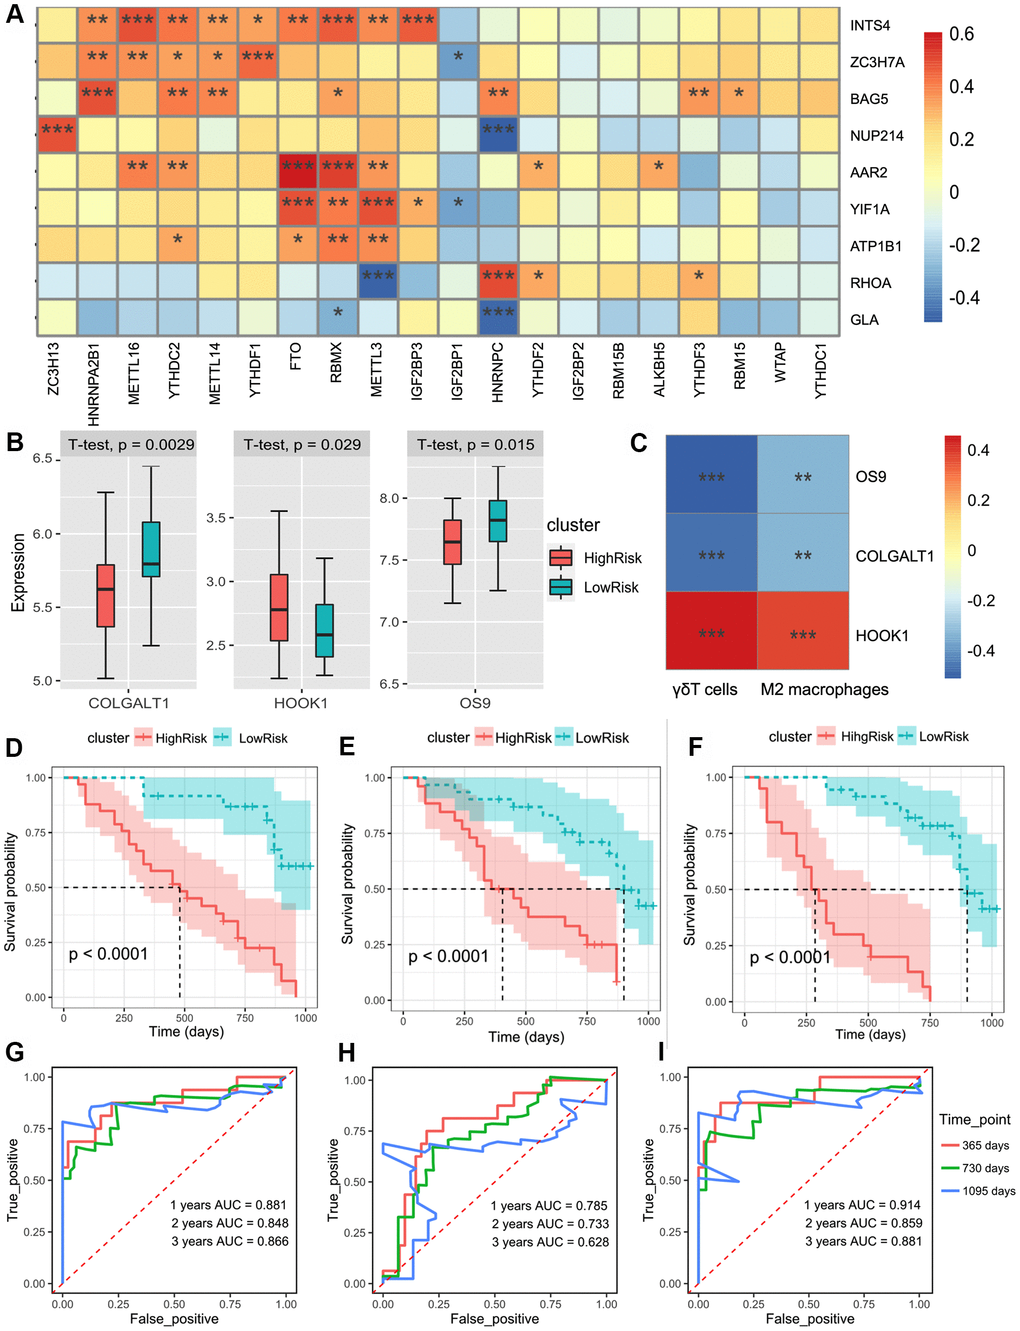
Figure 4.(A) The heatmap of the correlations between the m6A-related genes and 9 m6A-related-CoV genes in the whole blood of IPF. (B) Patients were divided into the low-risk group and high-risk group according to the infiltration of γδT cells and M2 macrophages. The box plot showed the difference of the COLGALT1, HOOK1, and OS9 between low-risk and high-risk groups. (C) The heatmap of the correlations between the 2 immune cell composition and 3 SARS-CoV-2 related DEGs. (D) Kaplan–Meier plot of overall survival in two clusters based on the risk models of m6A-related-CoV genes (Score 1). (E) Kaplan–Meier plot of overall survival in two clusters based on the risk models of the immune infiltration patterns (Score 2). (F) Kaplan–Meier plot of the overall survival in two clusters based on the risk models of the combined Cox regression model. (G) The ROC curve in the risk models of m6A-related-CoV genes (Score 1). (H) The ROC curve in the risk models of the immune infiltration patterns (Score 2). (I) The ROC curve in the risk models of the combined Cox regression model.