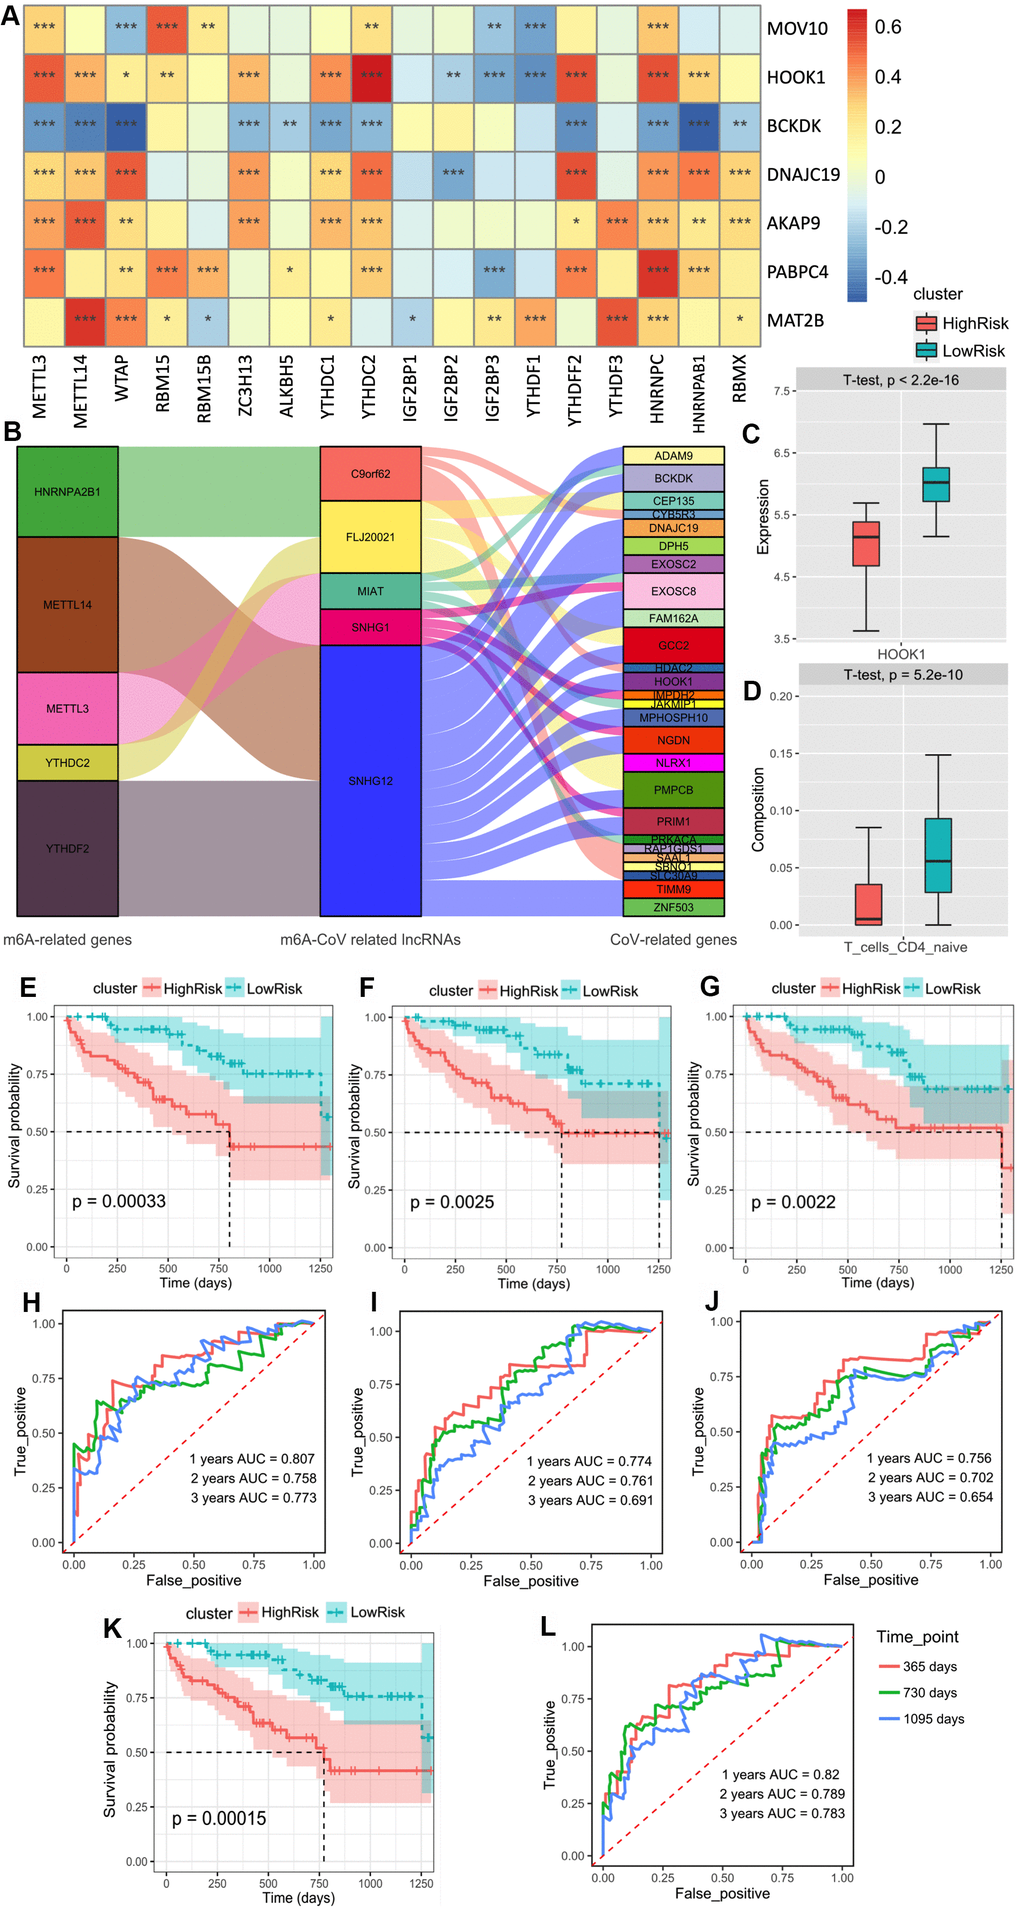
Figure 5.(A) The heatmap of the correlations between the m6A-related genes and 9 m6A-related-CoV genes in the peripheral blood mononuclear cell of IPF. (B) The alluvial diagram of the correlation between m6A-CoV related lncRNAs, m6A related genes, and SARS-COV-2 related genes. (C) The box plot of the discrepancy of the HOOK1 expression in two clusters based on the risk models of SARS-CoV-2 related immune infiltration patterns (Score 3). (D) The box plot of the discrepancy of the infiltration of the naïve CD4+ T cells in two clusters based on the risk models of SARS-CoV-2 related immune infiltration patterns (Score 3). (E) Kaplan–Meier plot of the overall survival in two clusters based on the risk models of m6A-related-CoV genes (Score 1). (F) Kaplan–Meier plot of the overall survival in two clusters based on the risk models of m6A-CoV related lncRNAs (Score 2). (G). Kaplan–Meier plot of the overall survival in two clusters based on the risk models of SARS-CoV-2 related immune infiltration patterns (Score 3). (H) The ROC curve in the risk models of m6A-related-CoV genes (Score 1). (I) The ROC curve in the risk models of m6A-CoV related lncRNAs (Score 2). (J) The ROC curve in the risk models of SARS-CoV-2 related immune infiltration patterns (Score 3). (K) Kaplan–Meier plot of the overall survival in two clusters based on the risk models of the combined Cox regression model. (L) The ROC curve in the risk models of the combined Cox regression model.