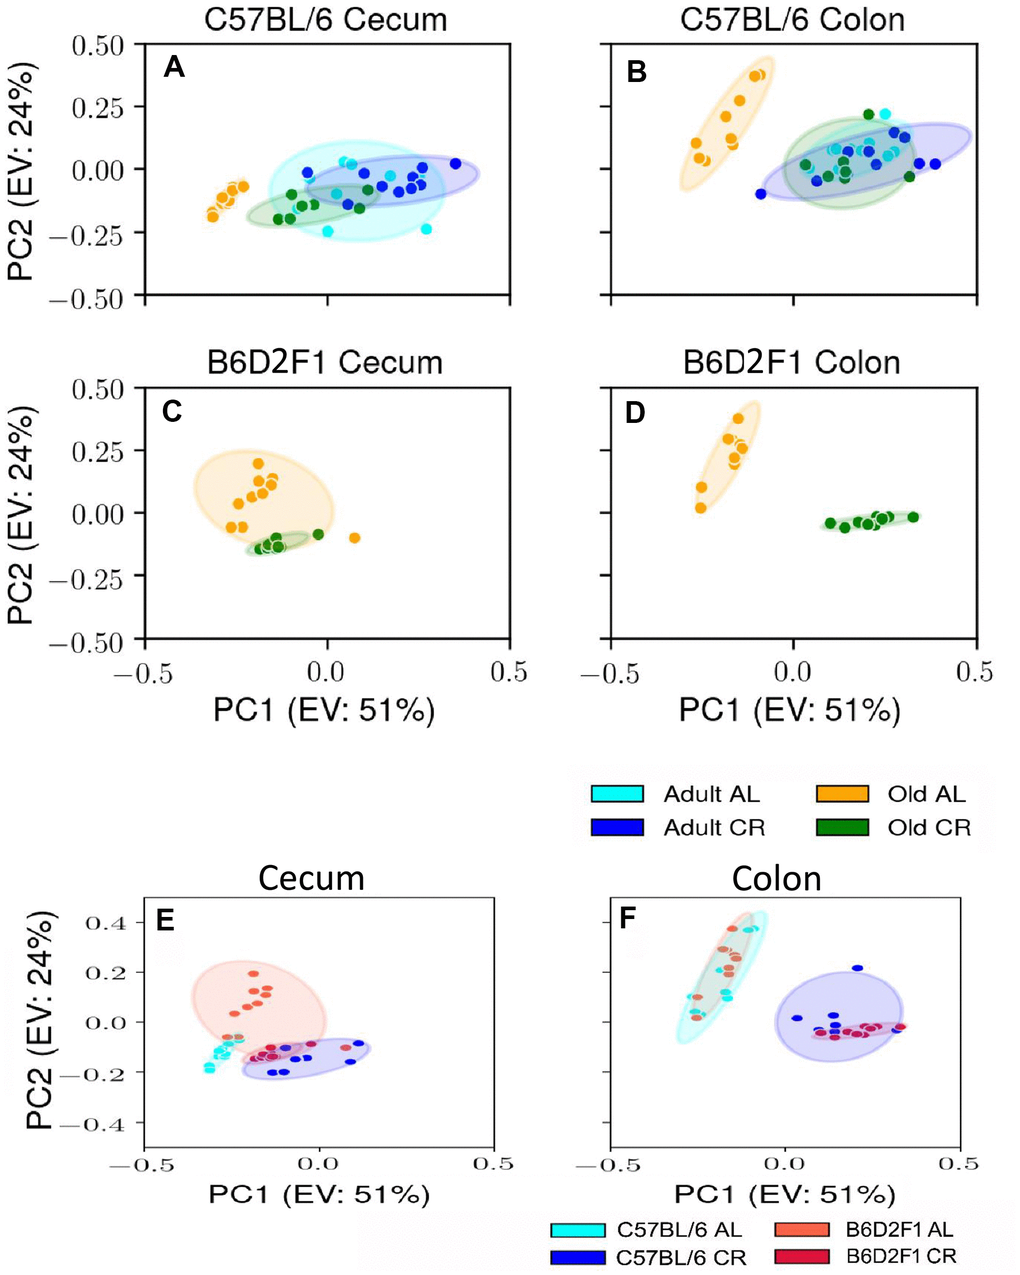
Figure 1.PCA plots showing the variance in the microbiome of mice fed AL and CR. The PCA plots are shown for the microbiome from the cecum (A) and colon (B) of adult and old C57BL/6JN mice fed AL or CR and from the cecum (C) and colon (D)of old B6D2F1 mice fed AL or CR. Panels (E, F) show PCA plots of the microbiome from the cecum and colon, respectively for old C57BL/6JN and B6D2F1 mice fed AL and CR. Ellipses are 95% confidence intervals for the group obtained using bootstrapping, and "EV: XX%" in the axis labels is the percentage of explained variance of the component.