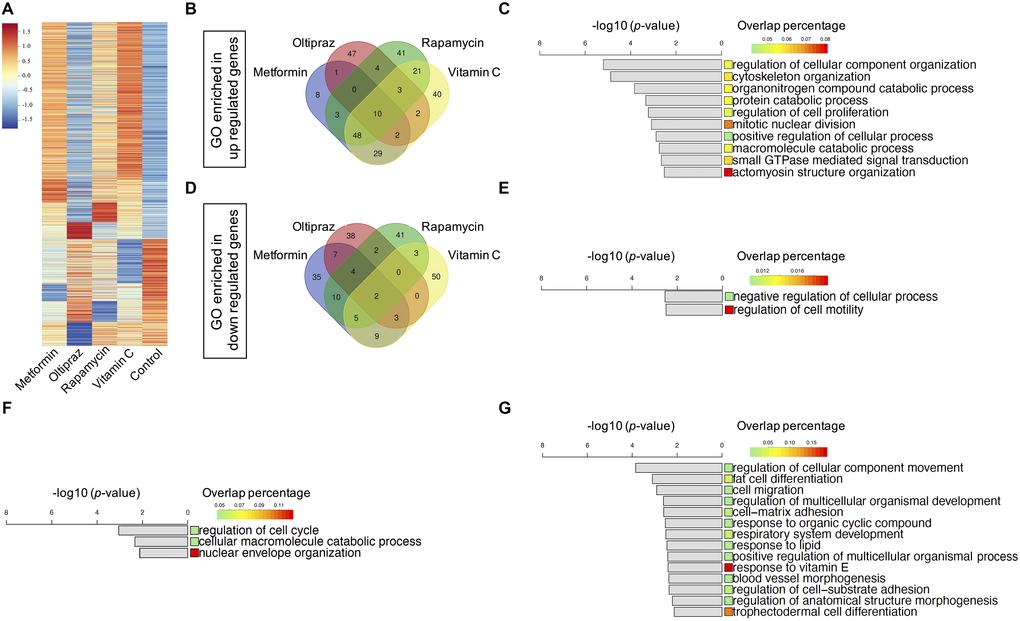
Figure 3.Transcriptomics characterization of drug induced BM-hMSCs. (A) 1758 DEGs with fold-change above 2 between drugs treatment group and control, which containing both upregulated and downregulated genes. (B) Venn diagram of the enriched upregulated GOs of the four drugs. (C) Ten common upregulated GOs shared by four drugs. (D) Venn diagram of the enriched downregulated GOs of the four drugs. (E) Two common downregulated GOs shared by four drugs. (F) Three common upregulated GOs shared by oltipraz and metformin. (G) Fourteen common downregulated GOs shared by oltipraz and metformin.