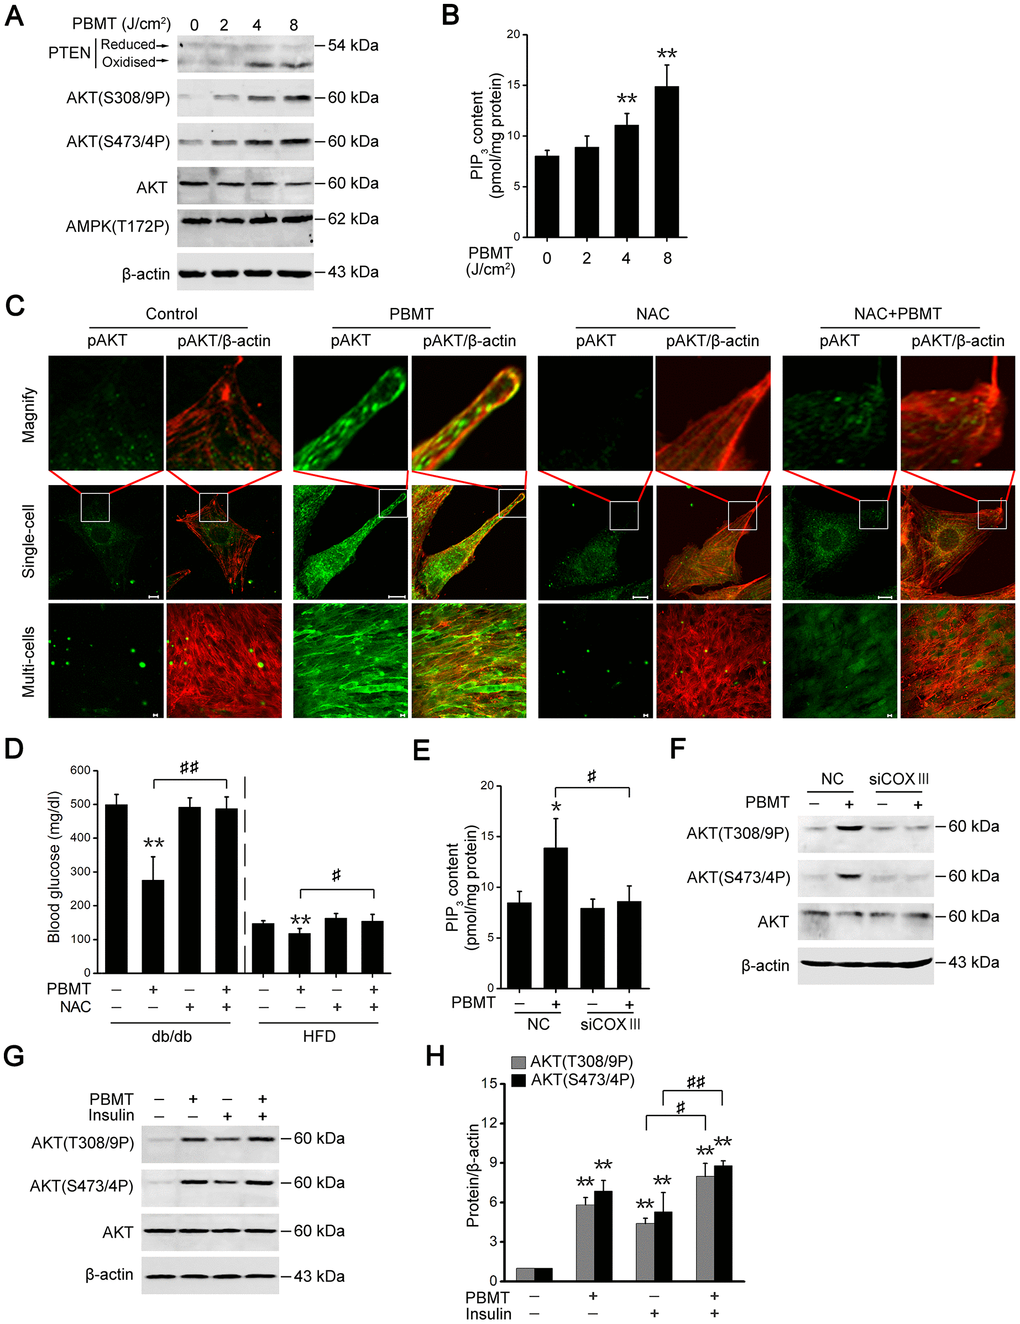
Figure 4.PBMT-increased ROS but not ATP improves insulin sensitivity by activating the PTEN/AKT signaling. (A) Immunoblot analysis of PTEN oxidation, AKT phosphorylation and AMPK phosphorylation in IR-L6 myotubes 30 min after different doses of laser irradiation. (B) Intracellular PIP3 levels in IR-L6 myotubes 30 min after different doses of laser irradiation. Mean ± SD, n = 4. **p < 0.01 vs. the PBMT-untreated group (Student’s t-test). (C) Representative immunofluorescence images of AKT(S473/4P) (green) and β-actin (red) in IR-L6 myotubes under the indicated treatments. Scale bar, 10 μm. (D) Fasting blood glucose in db/db mice and HFD-fed mice with the indicated treatments for three weeks and one week, respectively. Mice were injected intraperitoneally once daily with NAC (100 mg/kg) 30 min before each PBMT. Blood glucose was examined 12 hours after the last PBMT. Mean ± SD, n = 5. **p < 0.01 vs. the control groups; #p < 0.05, ##p < 0.01 vs. the indicated groups (Student’s t-test). (E, F) PIP3 content (n = 4) (E) and AKT phosphorylation (F) in IR-L6 myotubes transfected with NC or COXIII siRNA under the indicated treatments. The experiment was performed 30 min after PBMT. Mean ± SD. *p < 0.05 vs. the control groups; #p < 0.05 vs. the indicated group (Student’s t-test). (G, H) Immunoblot analysis (G) and gray analysis (H) of AKT phosphorylation in IR-L6 myotubes 30 min after PBMT or/and insulin treatments. Mean ± SD, n = 3. **p < 0.01 vs. the untreated groups; #p < 0.05, ##p < 0.01 vs. the indicated groups (Student’s t-test).