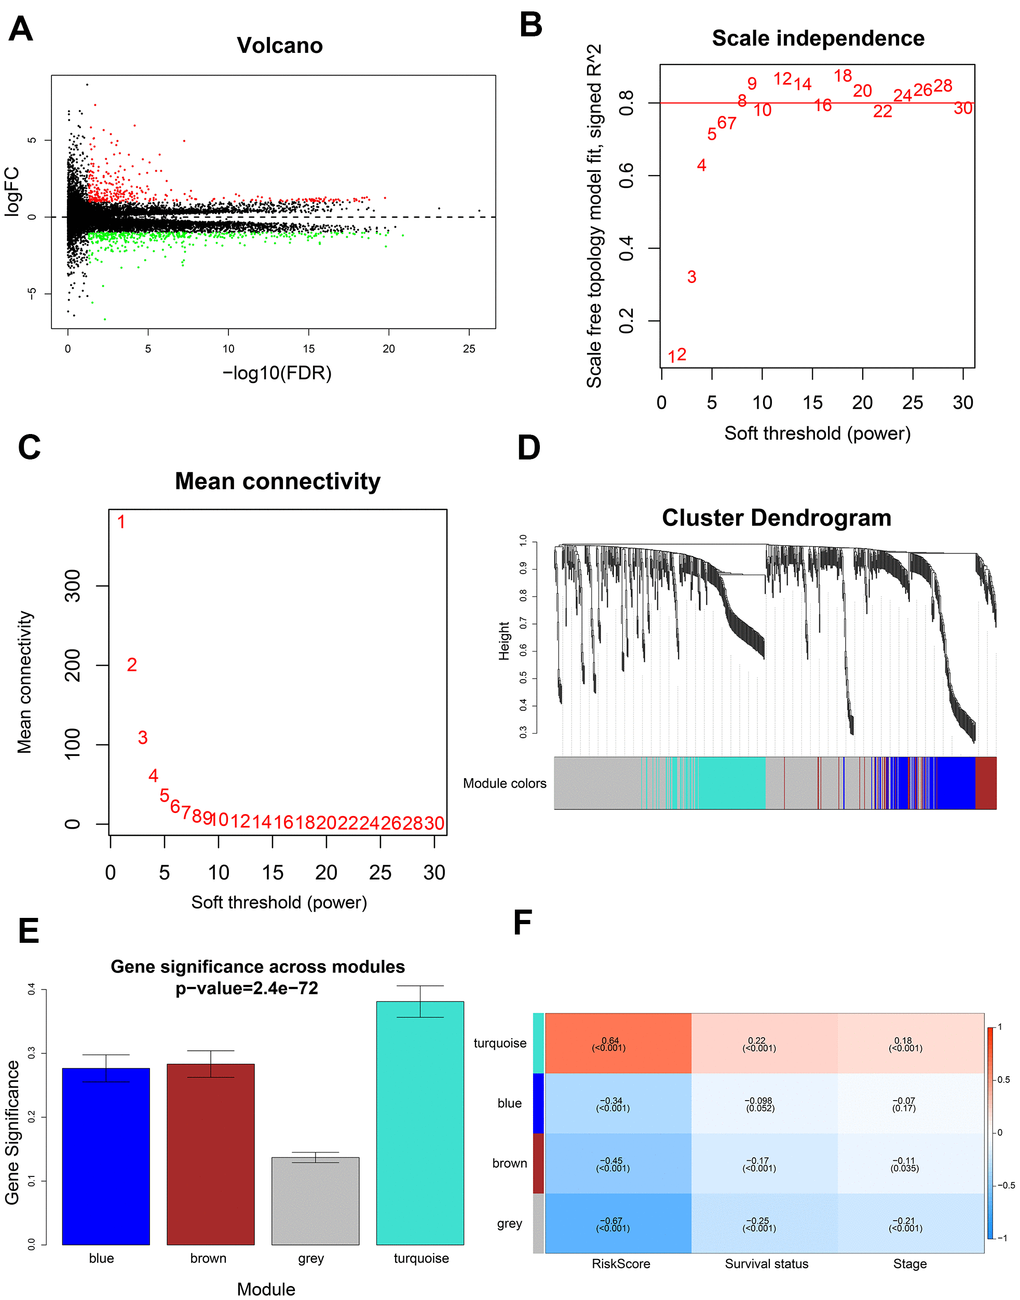
Figure 7.Identification of gene modules using WGCNA. (A) Volcano plot shows 741 differentially expressed genes or DEGs (335 up-regulated and 406 down-regulated) in 199 high-risk and 199 low-risk LADC patient groups. (B) Analysis of scale-free topology fit index for various soft threshold powers (β). (C) Analysis of mean connectivity for various soft threshold powers. (D) Dendrogram of all differentially expressed genes clustered into various gene modules on the basis of a topological overlap-derived dissimilarity measure. The modules are displayed with different colors in the horizontal bar below the dendrogram. (E) Distribution of gene significance values in different modules. (F) The module-trait relationship heat map shows the correlation between module eigengenes (MEs) and clinicopathological characteristics. The correlation coefficients and p values are shown in the column for each ME and the corresponding clinicopathological characteristic.