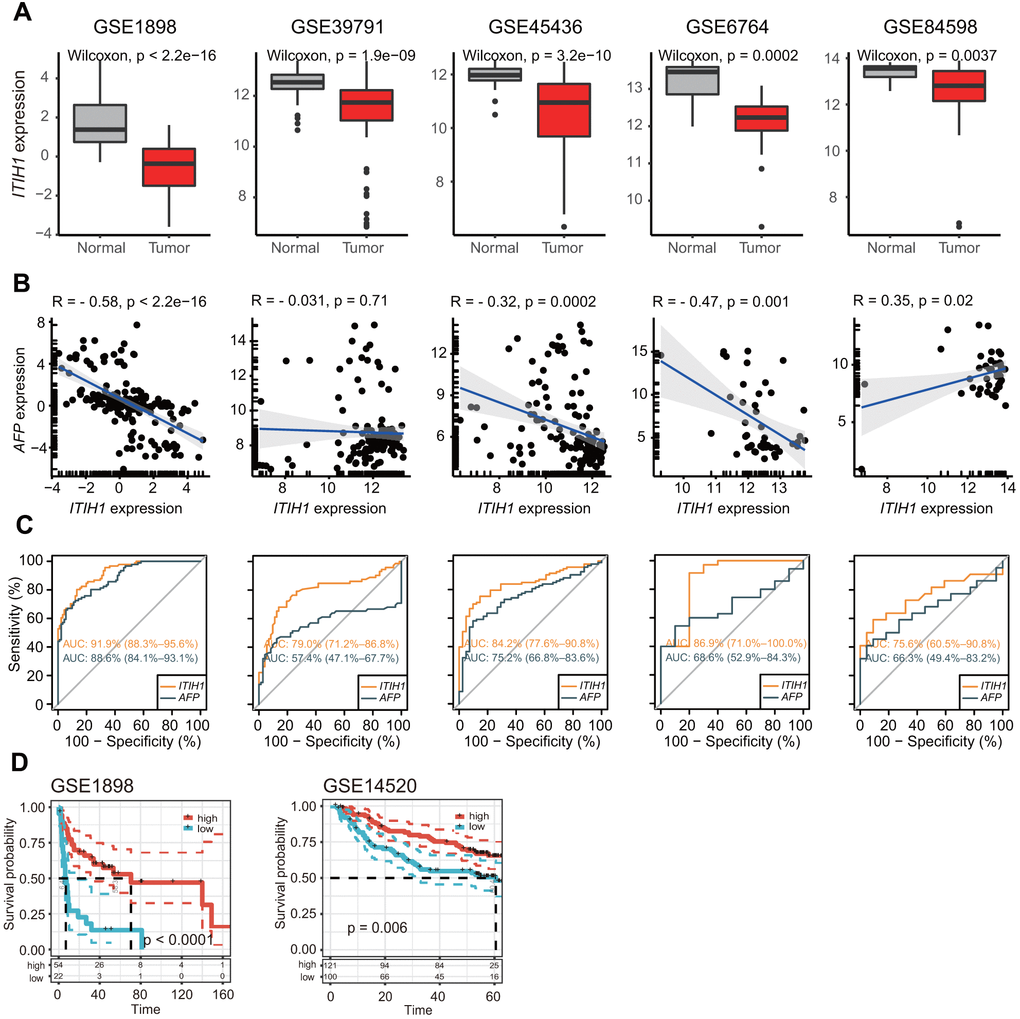
Figure 5.Independent validation of the differential expression and prognostic significance of ITIH1 in GEO datasets. (A) Boxplots showing the expression of ITIH1 in LIHC and normal controls from five GEO datasets (GSE1898, GSE39791, GSE45436, GSE6764, and GSE84598). (B) Scatterplots showing the correlation between ITIH1 and AFP expression in the five datasets as described in (A). Pearson correlations and p values are indicated. The linear models describing the correlations are depicted as blue lines. The marginal rugs drawn on the axis of the scatter plots were used to show the distributions of two variables. (C) Receiver operating characteristic (ROC) curves comparing the diagnostic performances of ITIH1 (orange curves) with AFP (black curves) in the five datasets as described in (A). (D) Kaplan-Meier curves representing OS of two LIHC cohorts from GEO (GSE1898, n = 76; GSE14520, n = 221) based on ITIH1 expression.